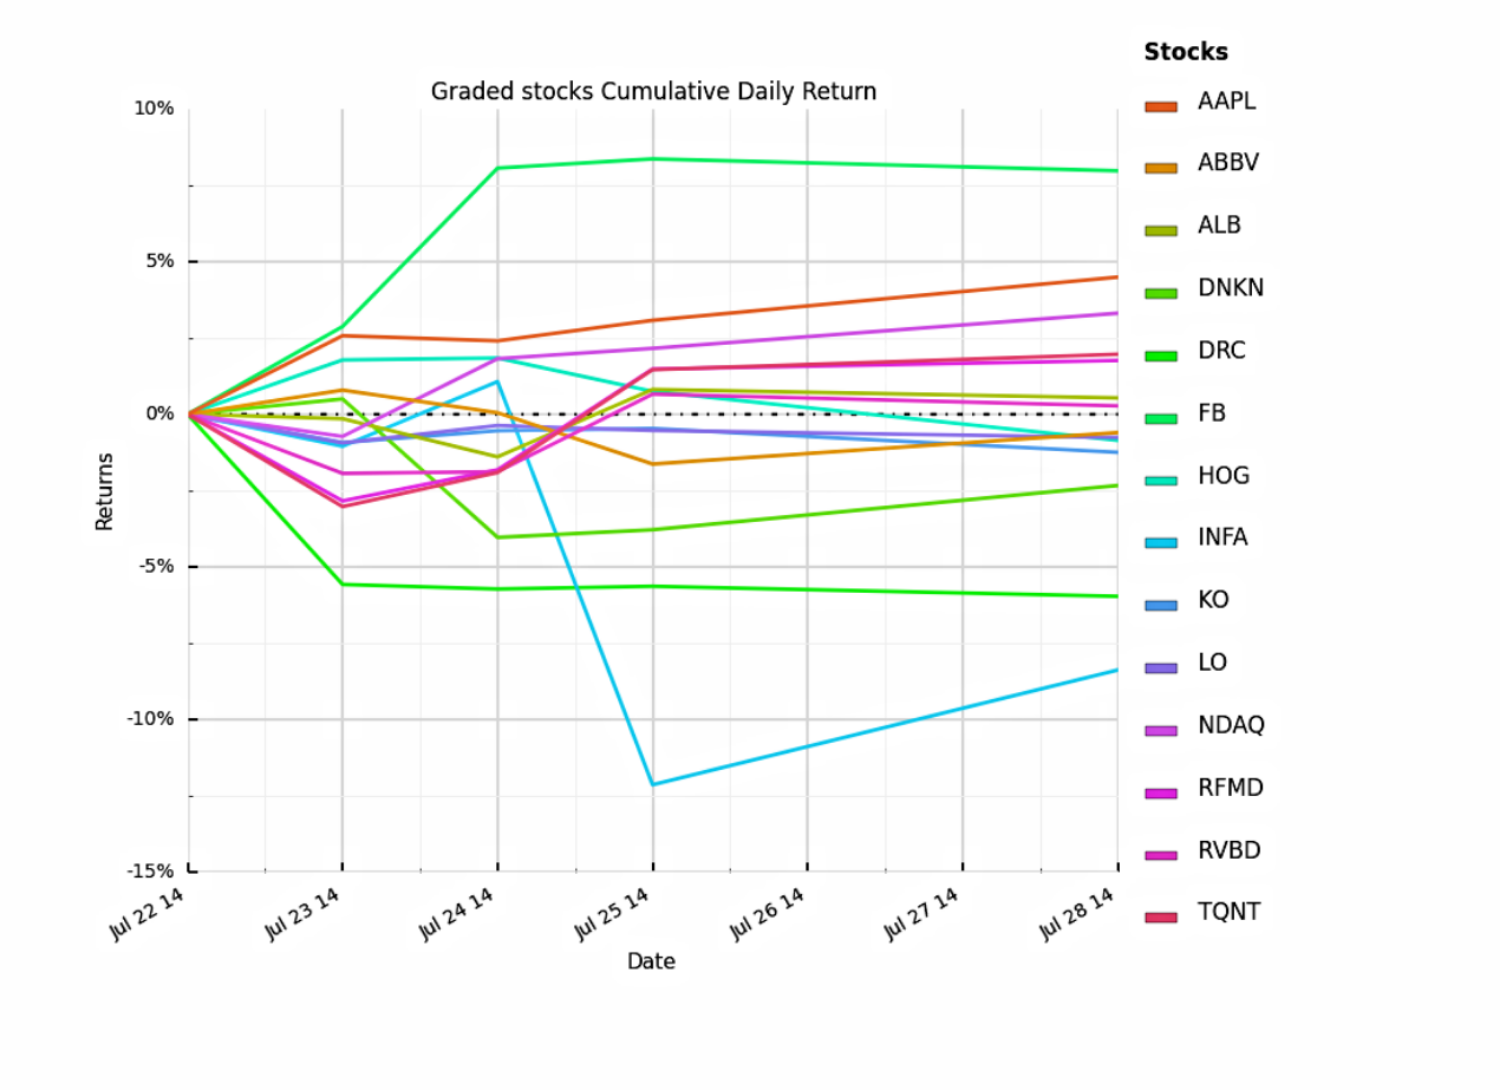
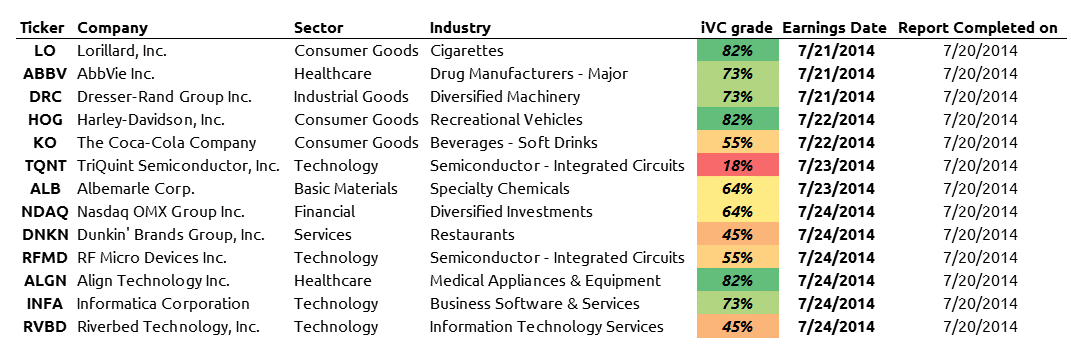
Project Update_iVC Reporting Engine

Still working industriously behind the scenes I thought to take some time and give a progress report. Good news is the iVC Reporting Engine is almost fully operational. I've been able to automate the following processes:

Data Collection: I have two methods to obtain public company filings from the SEC via Python scripts.

  • The primary method I use leverages the excellent services of the free (for now) data provider, Quandl.com. They aggregate and distribute data from several primary sources including the SEC and normalize as best as possible given whatever business constraints they have as a young riser. In congruence with their mission statement to improve data accessibility for all, they have also provided a Python module and general API for the motivated entities out there to automate data queries. 
  • Additionally I have a backup database of every public company filing since 2012, which leverages Arelle's open-source efforts to standardize and improve the XBRL standard for finance-IT adoption. My db is configured to use the PostgreSQL standard with Arelle's schema. This still requires more examination of the XBRL format, and/or command line interfaces to return the data I require. Marked: in Development for production purposes.
  • Data Processing: There is overlap with the above, however this includes organizing/filing of the data returned by the collection process. Not a lot to say here other than the files are self-organizing and allow for flexible structures during continued operational development. 

Calculation Engine: This is pretty much the final major component before large scale testing can begin. It is broken down as follows. 

  • I've been able to transition ~99% of my previous Excel and Python calculations into this component. It accesses the processed data, and strips it down to run the calculations as efficiently as possible currently averaging ~15.5 secs per cycle. 

Under Construction: All that's left really is to incorporate the plotting/charting functions and final production output format. Once that is complete live production testing can begin.

You better tell somebody, Blackarbs LLC is coming. 


Walking the Path takes time...

Readers, 

I have been away somewhat after my declaration of providing more useful and interesting content. Why is that? Am I being hypocritical or something worse?

The answer is neither. The essence of the Blackarbs mission is to continuously find ways to add value to investors anywhere and everywhere they may be. Born out of that mission is the iVC report which has helped a few portfolio managers, and private investors (including myself) make prudent well timed investments in value creating stocks (Details to come in a future post). 

To better help current and prospective clients I relentlessly evaluate the current reports, the report creation process and its efficacy as a research tool. I've concluded that the stock reports are incredibly effective at identifying value creators and destroyers within the public equity space but the current, report creation process is NOT SCALABLE. 

Unfortunately I am unable to produce these reports on a massive scale because it takes to long to generate one. When I first began production it took ~4-5 hours to produce a single report. Now it can be done in ~1-1.5 hours which is a dramatic improvement but not nearly fast enough. If there are roughly 3000-5000 stocks in our potential investment universe we can see the time investment needed to evaluate even a subsection of stocks is too great.

THE SOLUTION:

It's simple, the report creation process needs to be automated as much as possible. As a result I've spent the last 12 days working on this programmatically having experimented with solutions based primarily in Python. After building 2 different web scrapers and a calculation engine I realized each 'free' fundamental data source I found presented unique challenges due to their html/javascript structure or some strange reporting convention they use.

Me in the lab 


Enter XBRL. If you are not familiar XBRL is the cutting edge financial reporting standard based on the XML documentation 'language' that the SEC has mandated public companies adhere to. Essentially publicly traded firms have a mandate to provide all their fundamental SEC/financial data in this semi consistent format which is ..."easily"... accessed  by software. 

Make no mistake as a result of being 'cutting edge' and in development, the XBRL standard is not simple or easy, yet. However, it is the best solution in that the calculation engine I use to analyze the companies and output grades will be based on data provided directly to and by the SEC! This is a massive upgrade IMHO to third party data providers. This project is ongoing and Blackarbs' progress in developing and implementing this solution is fast-paced. 

So please forgive the sporadic posts until the report generation engine is completed hopefully within the next two weeks. 

Stocks - Post Earnings UPDATE (week of July 21, 2014)

Let's take a look at how the previously graded stocks have performed over the last ~10 days.

Please note this is a raw analysis in that these stocks reported at different times last week, so cumulative performance may be affected by the date they reported in addition to other factors. 

returns comparisons

returns comparisons

The key take away for me regarding this chart is that most of the returns on this extremely short time scale cluster between +/- 5%.  There are a couple relatively 'extreme' movements by this collection of stocks. Let's look at the next chart which allows for more detailed analysis.

returns comparison_facet

returns comparison_facet

First, for context the cumulative return for 'risky' assets is negative over the last 10 days. We can see this when using 'SPY' and 'HYG' as proxies for investors' risk appetite. 

For reference the stocks with an 'Investment Prospect' grade ( iVC score > 60% ) included: AAPL, ABBV, ALB, ALGN,  DRC, FB, HOG, INFA, LO, NDAQ;

Stocks with a 'Neutral' grade (  45% <= iVC score <= 60% ) included: DNKN, KO, RFMD, RVBD;

Stocks with a 'Sell / Short Target' grade ( iVC score < 45% ) included: TQNT

Of  the 10 stocks with an Investment Prospect grade only 5 have positive cumulative returns over this timespan. Admittedly I haven't updated all the grades (post earnings) for these firms yet but will be doing so over the next quarter. So, without knowing each of these firm's current guidance does the fact that the other 5 investment prospects have under performed mean they are now terrible stocks and my scoring process is garbage? Only time will tell. BUT...

...lets be clear only DRC, and INFA would have a blown a hole in your portfolio if you were long these stocks going into earnings. Surprisingly ALL of the other investment prospects have outperformed or remained within an approximate 1% cumulative decline which happens to mirror the returns of the broader market and other risky assets (SPY, HYG) during the same time frame. I'll chalk this up to a win for the preliminary Blackarbs 'iVC' grading process.  

Now looking at the stock returns of the equities with a neutral grade we see the results are split! DNKN, and KO have declined while RFMD and RVBD have appreciated. This is actually a desired result and exactly what I would expect and hope to see in this context. Neutral grades mean we see no 'obvious' asymmetric risk:reward setups; or in other words, these stocks are or should be equally likely to appreciate or decline in value over some time span. Score another win for Blackarbs grading process.

Now let's look at TQNT which is the only equity with a failing or short target grade. Thus far TQNT has appreciated ~2% over this time period. This could be a function of two important factors one needs to consider during the investment process especially during earnings periods.

Investor expectations, and Industry.

Simply put a great company with a great stock could report stellar earnings but if the company fails to meet investor expectations the stock is likely to decline in the immediate aftermath. The same is true in reverse. TQNT registered one of the worst equity grades (18%) Blackarbs has recorded thus far which could be an indicator that, while the company is clearly struggling, investor expectations are (could be) at their lowest. Therefore ANY positive results from the earnings report could act as a catalyst for the stock to appreciate. The second factor of importance is the industry the firm operates in. TQNT is a semiconductor company. If you have been following the markets you know that this is one of the *hottest* and strongest performing sub-industries of the Technology sector this year. The expression 'a rising tide lifts all boats' is applicable here. In the short term both of these factors could be contributing to the TQNT's short term outperformance. Only time will tell with this one. So far this is a loss for the grading scale with an opportunity to become a win. 

Preliminary Blackarbs IVC grades are 2/3 thus far. I like the start and will look to continue this feature moving forward.

Stocks - Pre Earnings Equity Grade (week of 07.21.14)

With the iVC reports showing some preliminary promise, I thought it would be worthwhile to begin tracking any potential predictive ability of the grading system. It's late so it's likely I'll have to update this post with better prose after I get some sleep. See this week's pre-earnings grades below. The reports are available for sale through the shop. 

equity grades_pre earnings week of 7.21.14


Why I'm Bullish on Facebook (FB) Long Term

facebook-whatsapp-feature-img.jpg

I am bullish on FB because I believe the firm's strategic vision is sound and recent moves have put FB in a position to build on and maintain a competitive advantage well into the future. There are 4 keys to my thesis:

  1. FB is the current market leader in the social networking space
  2. FB has just begun to monetize its user base and ad platform
  3. Whatsapp's potential value is much greater than 19 billion paid
  4. Mobile technology industry will continue to grow globally

Facebook is the undisputed king of social media and still expanding.

FB has a total base of 1.2 Billion monthly active users. It's standalone acquisitions and apps have the following estimated users:

  • Instagram ~200 million
  • FB messenger ~200 million
  • Whatsapp ~500 million (50 million added since acquisition announcement in Feb; 70% of  the total MAU is active on a daily basis)

The last point regarding Whatsapp users is critical; 350 million users are active every day. This is the highest user engagement in the social networking space I am aware of.

FB's size and business model will allow it to achieve greater economies of scale. FB does not sell hardware, it does not sell phones or tv's. FB provides users users a method and platform to communicate and share experiences digitally, instantaneously, globally. I believe all of their acquisitions seek to bolster this user experience. FB sells businesses use of their platform to market and distribute digital ads, products, and services to targeted, engaged users. FB is investing actively in this area in an effort to help drive its adoption as the preferred corporate marketing platform on the web.

All this is to say their model is built on leverage. As their platform gains efficiency costs to run the core services should decline bolstering operating margins. Near term margins are likely to decline due to the recent acquisitions of Oculus and Whatsapp, which will require continued investment. However, this effect may be somewhat neutralized if FB is still growing revenues faster than expenses.

FB has just begun to monetize its ad platform.

I see evidence based on FB's revenue growth. Sequentially revenues grew at ~55% year over year with Q1FY14 revenues up ~72% compared to Q1FY13. This is incredible considering revenues are already closing in on double digit billions.

FB's platform has now garnered international credibility and support considering the Publicis deal which is estimated at $500 million. Instagram has just began monetizing its user base via ads within the last year. Whatsapp hasn't even started yet...

Furthermore, I believe the popularity of FB ads will increase due to the largely unobtrusive ad placements in newsfeeds. People love to complain about the data mining that FB has to do in order to provide its ad services but I've noticed the ads have grown more relevant and often appear similar to stories, news, or videos any one of your friends would share with you.

I believe this is a major catalyst that will lead to greater corporate adoption of the FB platform.

Whatsapp's potential value is much greater than 19 billion paid.

Ultimately a bullish bet on FB is a bullish bet on Whatsapp. It is my belief that most investors were initially stunned with the $19B purchase price especially considering Whatsapp had negligible revenues to speak of, no marketing, and a CEO and management team whose slogan is literally "no ads, no games, no gimmicks". I know because I was also stunned.

After mulling it over and modeling some scenarios the price tag seems wholly justifiable and could potentially be a bargain... First lets review the press release FB issued regarding the Whatsapp deal.

FB_Whatsapp Key Stats_Acquisition

FB_Whatsapp Key Stats_Acquisition

These numbers are staggering. Using these data points as a foundation I modeled what I thought was a reasonable growth sensitivity table. (Feel free to download the model and input your own assumptions in the blue cells)

Click here for the free downloadable spreadsheet version

If FB is able to monetize Whatsapp's projected user base at the current $1 per user, the present value of those sales is ~1.1B. If we use the current industry average P/S multiple of 11x (large cap, internet information providers), then those revenues are worth an additional $12B in market cap or $5 per share. I believe this is NOT priced into the stock as FB has declined ~5% or ~$3.50 since the announcement on Feb 19, 2014. This is also aligns somewhat closely to my current DCF price target of ~$69.

The value of $42 per user implied by Whatsapp's purchase price may be bargain according to Forbes. I suggest you read the entire article as it presents an alternative bull case not being considered by the market.

CitingForbes:

...How can it be that WeChat's users are worth $231, Line's are worth $73, WhatsApp's are worth $42 and Viber's are worth $9...It turns out that an international user is only worth less than a Western user if you only sell ads. It all comes down to monetization of those users.  The Asian messaging companies are vastly ahead of the North American messaging companies in terms of how they monetize...Unlike in America, where the only way we seem to monetize a consumer app is through shoving ads at us constantly, over there, WeChat and Line make money through selling stickers, games, and also buying things. For example, you can now pay for taxis and food in China through the WeChat app.  In Thailand recently, Line did a group-buying flash sale which was incredibly successful.  It turns out, if you aggregate the users, you can sell to them.  Ads are not really part of this equation...


The mobile phone market is still growing faster than GDP:

The International Data Corporation (IDC) projects mobile smartphone growth is expected to decline from current year's estimates of ~19% to ~7% by 2018. This is straightforward as a growing industry projects as a tailwind even though growth is projected decline sequentially y/y. To me this implies increasing competition between hardware manufacturers and a bifurcation in the mobile technology industry. Incorporating this into my analysis the base case has the market growing above the commonly used 5% long term stable growth rate. This is critical for attracting continued investment flows.

This is the foundation of my thesis and as long as the evidence skews in support of this thesis I will keep looking to invest in FB.


Disclosures: I am long FB.