

Stay Long Stocks Until...
/
...the Fed stops buying Bonds. It's as simple as that. The Fed has committed to purchasing $45 billion in treasuries and $40 billion in MBS per month for the foreseeable future. That's a run rate of ~1 trillion a year! The "Fed put" is real and I can prove it. Look at the following chart.

US Federal Reserve Total Assets data by YCharts
The plot starts on 11/25/2008 or the beginning of the first Quantitative Easing program (QE1). We can see there is a clear relationship between the Federal Reserve's balance sheet and the broader market (S&P 500). In fact the the correlation is ~92%. Furthermore notice that during periods where the Fed balance sheet has stabilized, the S&P experienced higher price volatility.
Chart number 2 plots the S&P 500 index level against the Fed asset level using data points from 11/25/2008 to present.
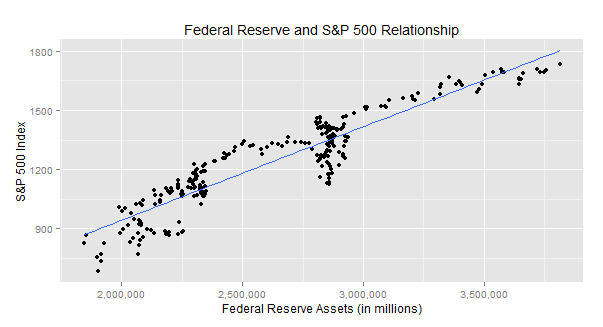
Notice the linear relationship between the two. In fact I ran a simple regression model which produced an R^2 of ~86%. That means ~86% of the variability of the S&P 500 price level is explained by the size of the Federal Reserve's balance sheet!
Simply put, if the Fed is continuing to to buy bonds and increase its balance sheet then keep buying stocks! My R code is provided below.
| library(Quandl) | |
| library(ggplot2) | |
| ## import data using Quandl api collapsing SPX into weekly data ## | |
| spx = Quandl('YAHOO/INDEX_GSPC',start_date='2008-11-25',collapse='weekly') | |
| fed = Quandl('FRED/WALCL', start_date='2008-11-25') | |
| ## run simple linear regression using adjusted close for SPX ## | |
| reg=lm(spx[,7] ~ fed[,2]) | |
| summary(reg) | |
| ## summary regression output ## | |
| lm(formula = spx[, 7] ~ fed[, 2]) | |
| Residuals: | |
| Min 1Q Median 3Q Max | |
| -227.08 -58.30 16.48 65.16 157.53 | |
| Coefficients: | |
| Estimate Std. Error t value Pr(>|t|) | |
| (Intercept) -1.450e+00 3.221e+01 -0.045 0.964 | |
| fed[, 2] 4.731e-04 1.203e-05 39.343 <2e-16 | |
| (Intercept) | |
| fed[, 2] *** | |
| --- | |
| Signif. codes: 0 ‘***’ 0.001 ‘**’ 0.01 ‘*’ 0.05 ‘.’ 0.1 ‘ ’ 1 | |
| Residual standard error: 87.67 on 254 degrees of freedom | |
| Multiple R-squared: 0.859, Adjusted R-squared: 0.8585 | |
| F-statistic: 1548 on 1 and 254 DF, p-value: < 2.2e-16 |

