

COMPOSITE MACRO ETF WEEKLY ANALYTICS (4/09/2016)
/FOR A DEEPER DIVE INTO ETF PERFORMANCE AND RELATIVE VALUE SUBSCRIBE TO THE ETF INTERNAL ANALYTICS PACKAGE HERE
LAYOUT (Organized by Time Period):
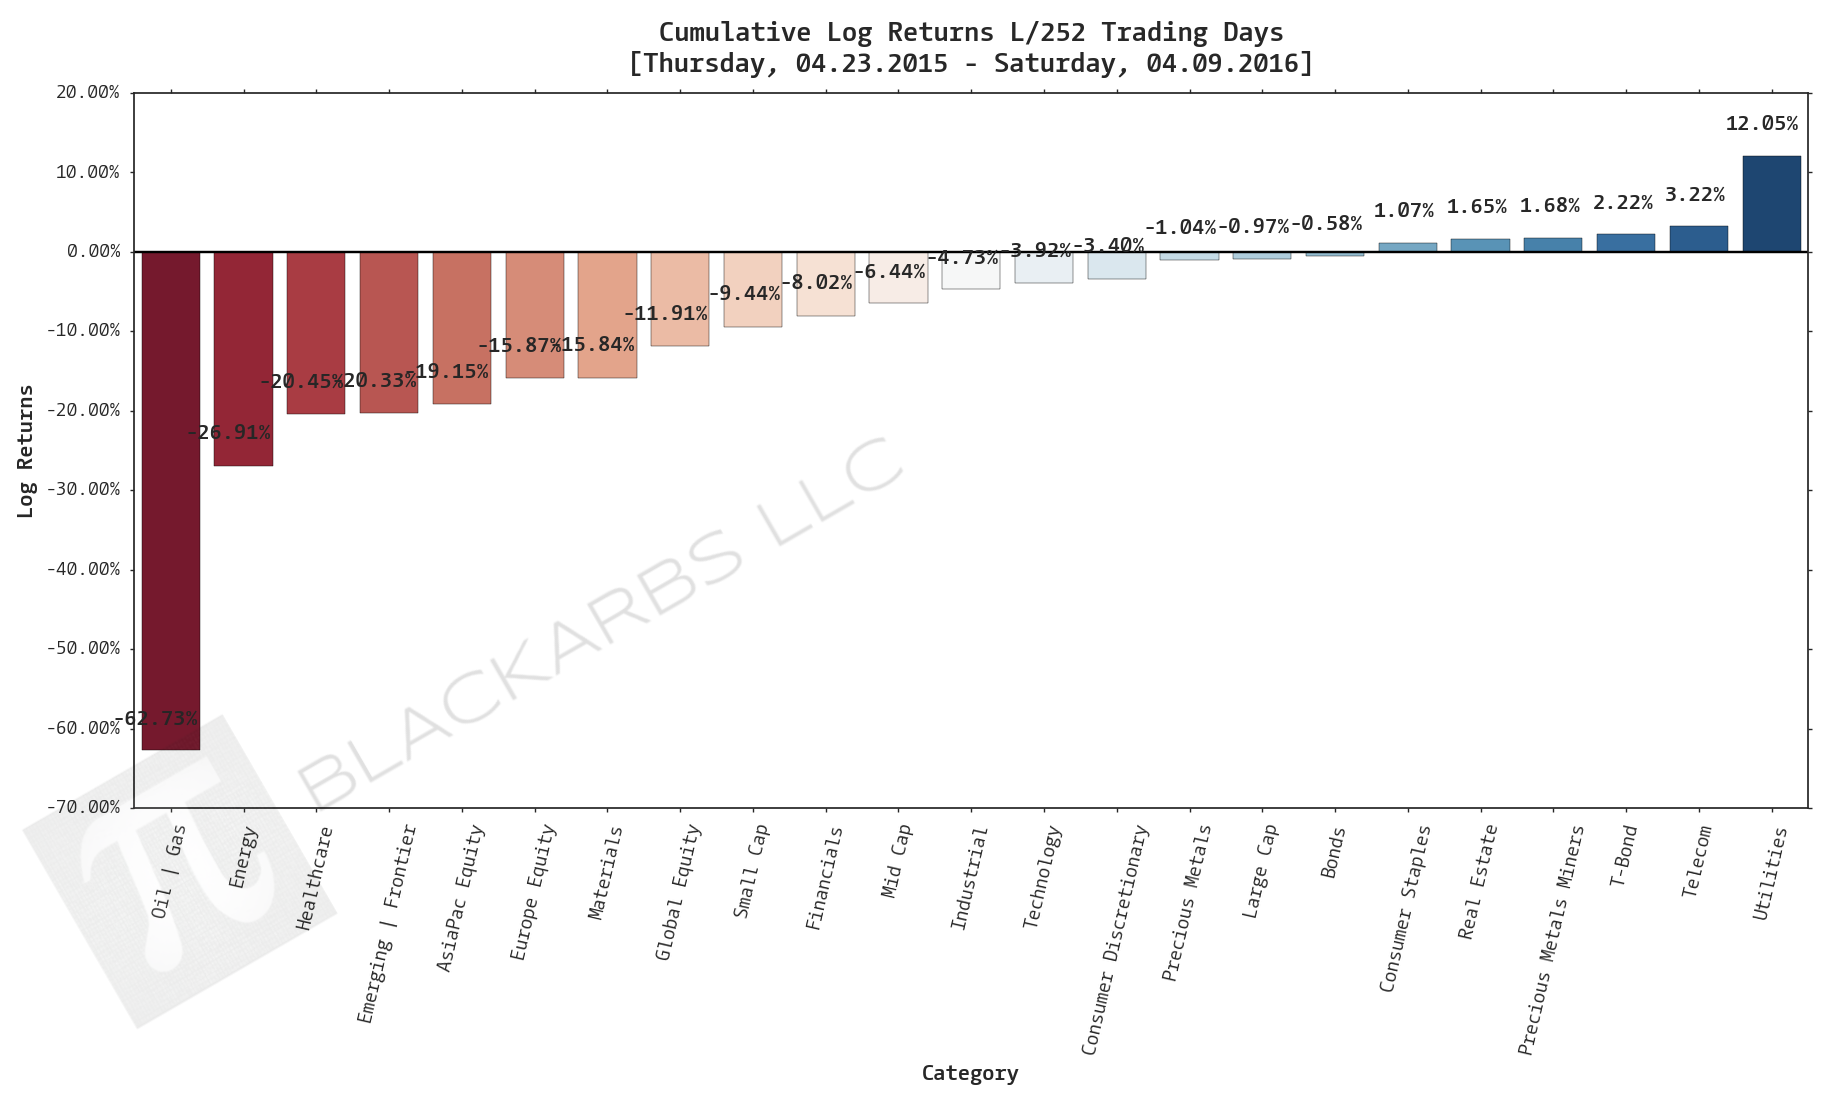
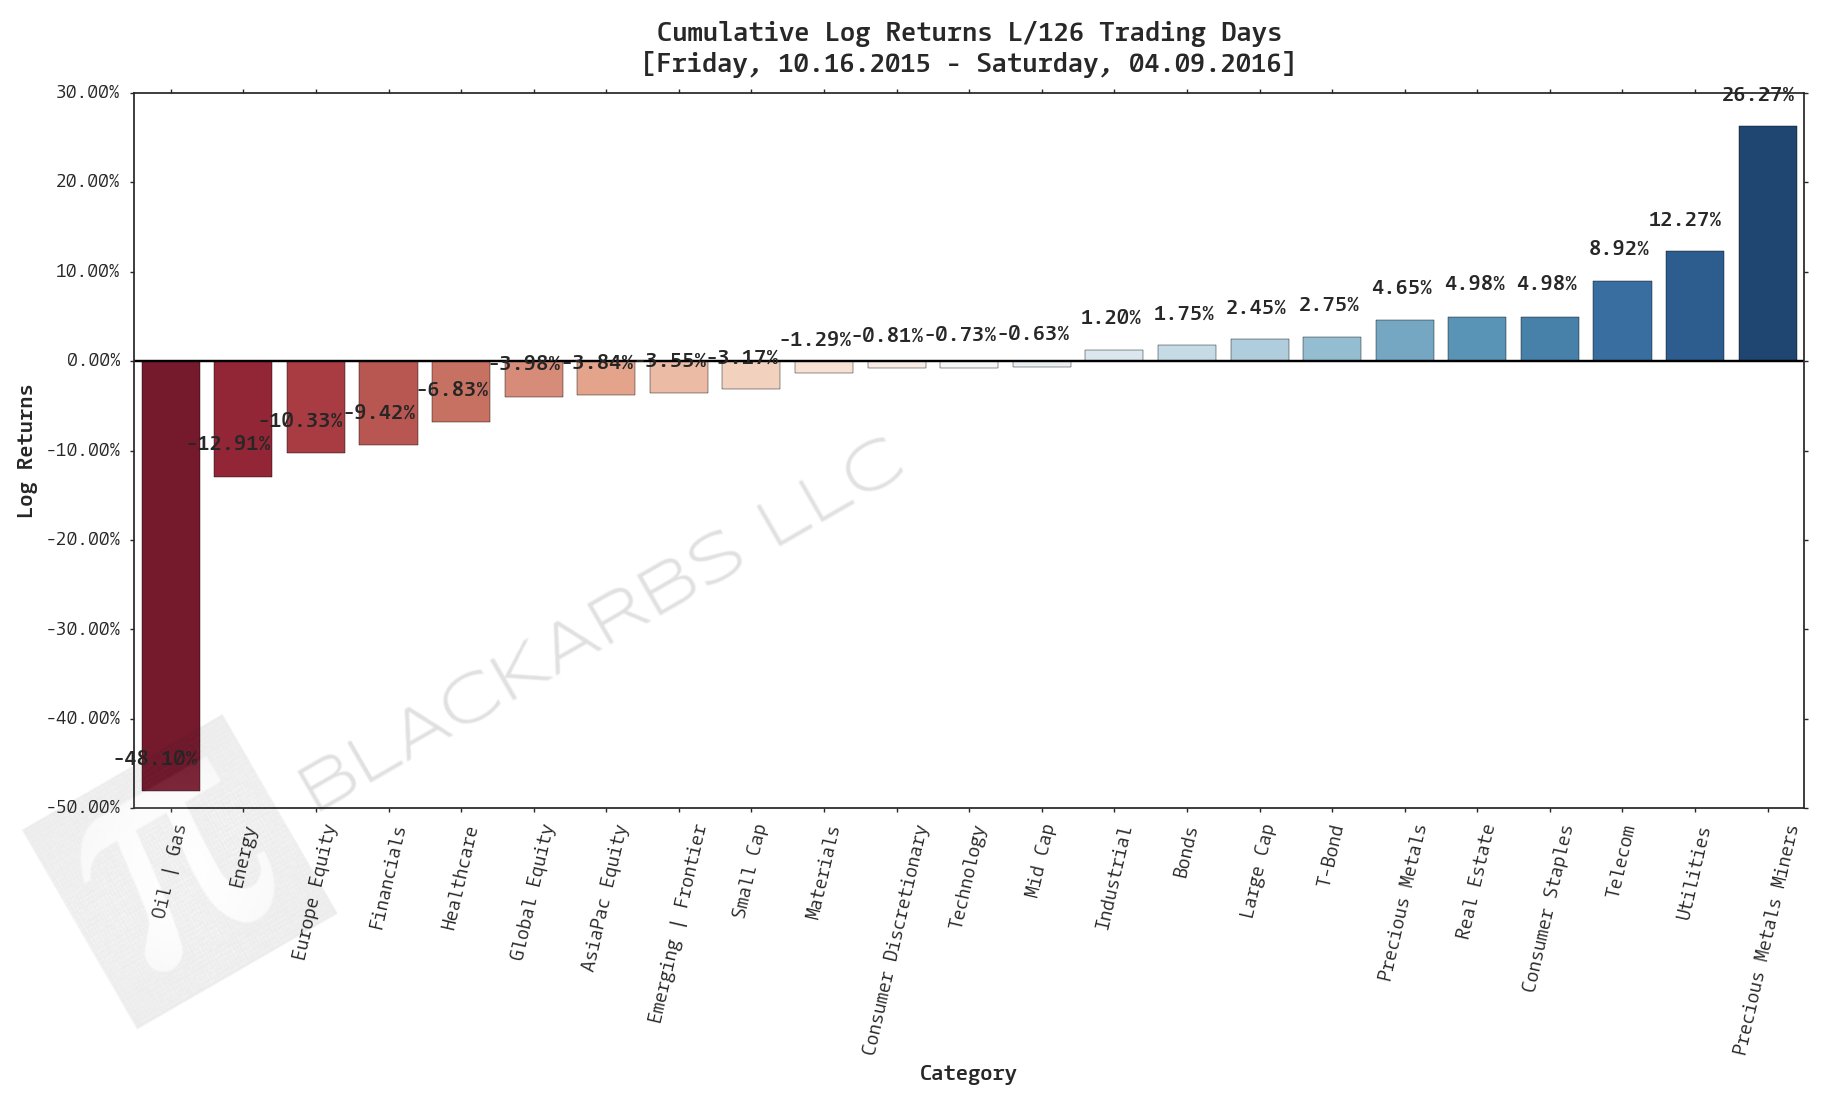
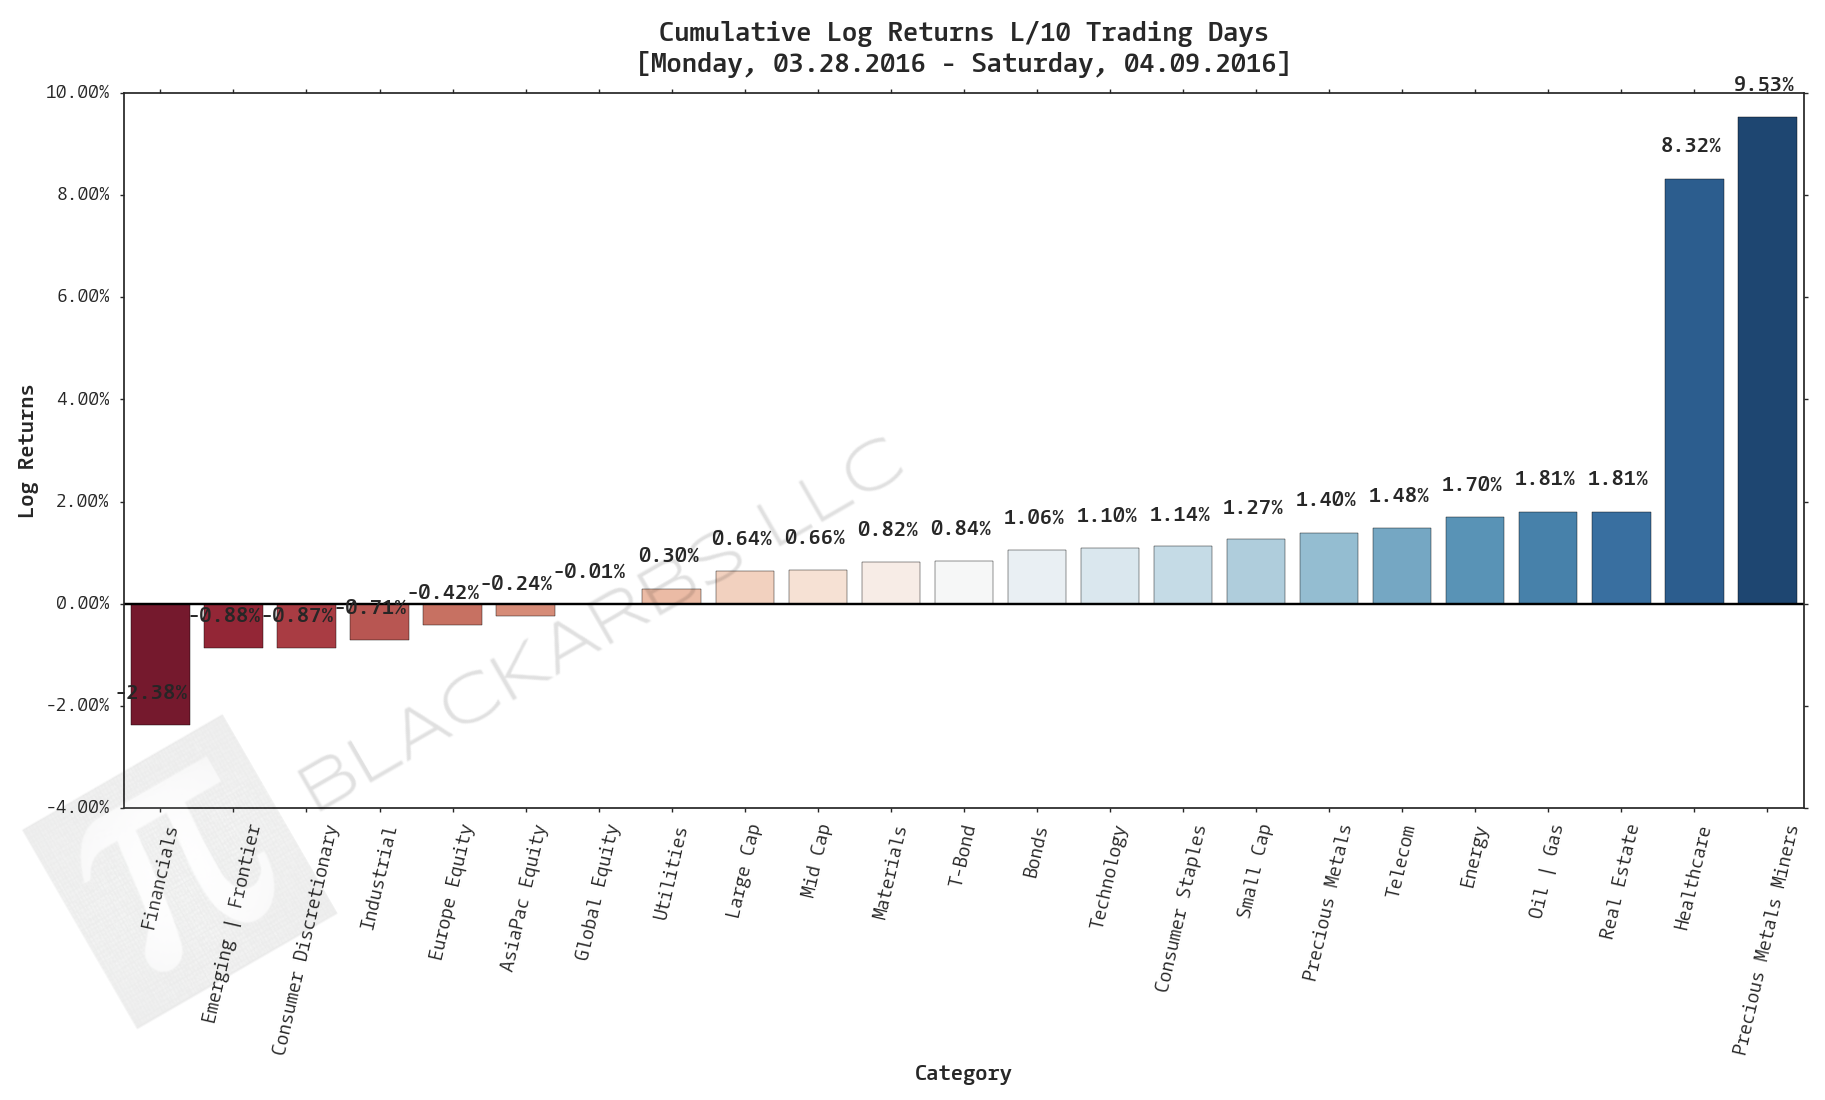
Composite ETF Cumulative Returns Momentum Bar plot
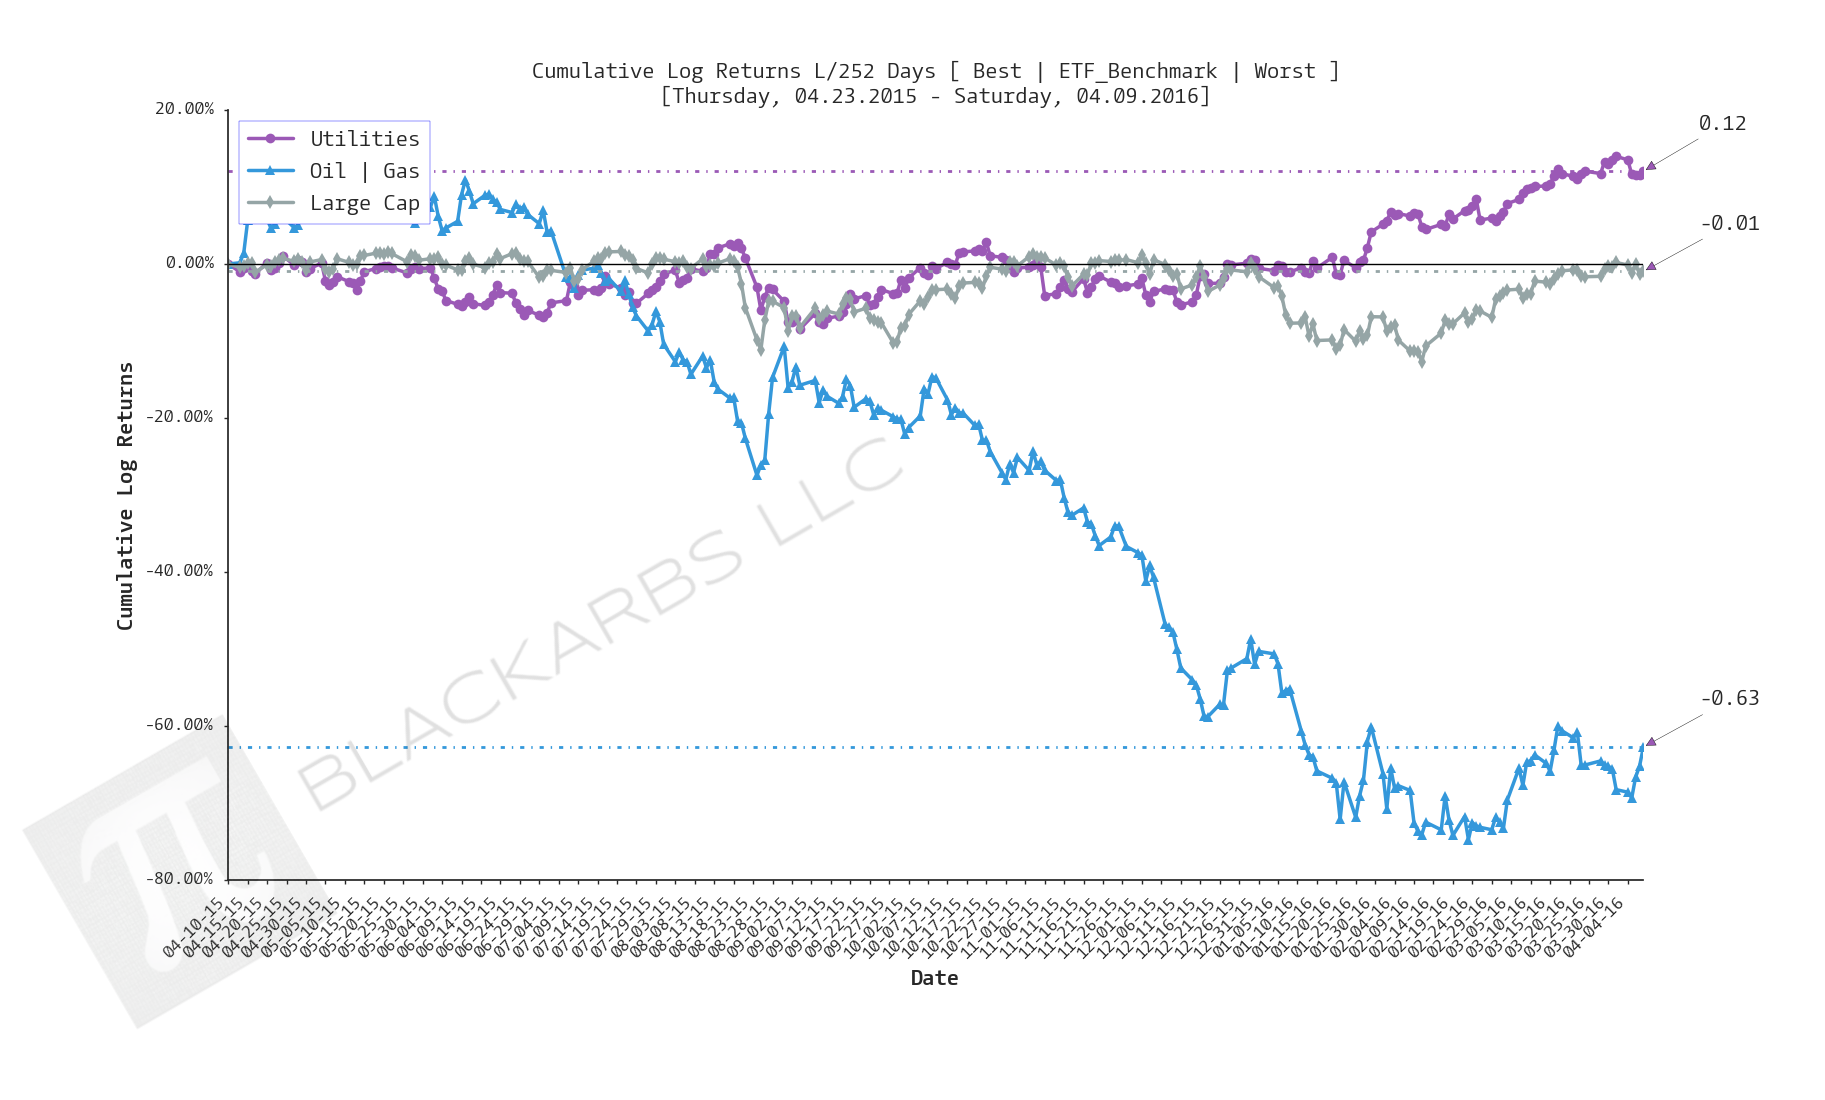
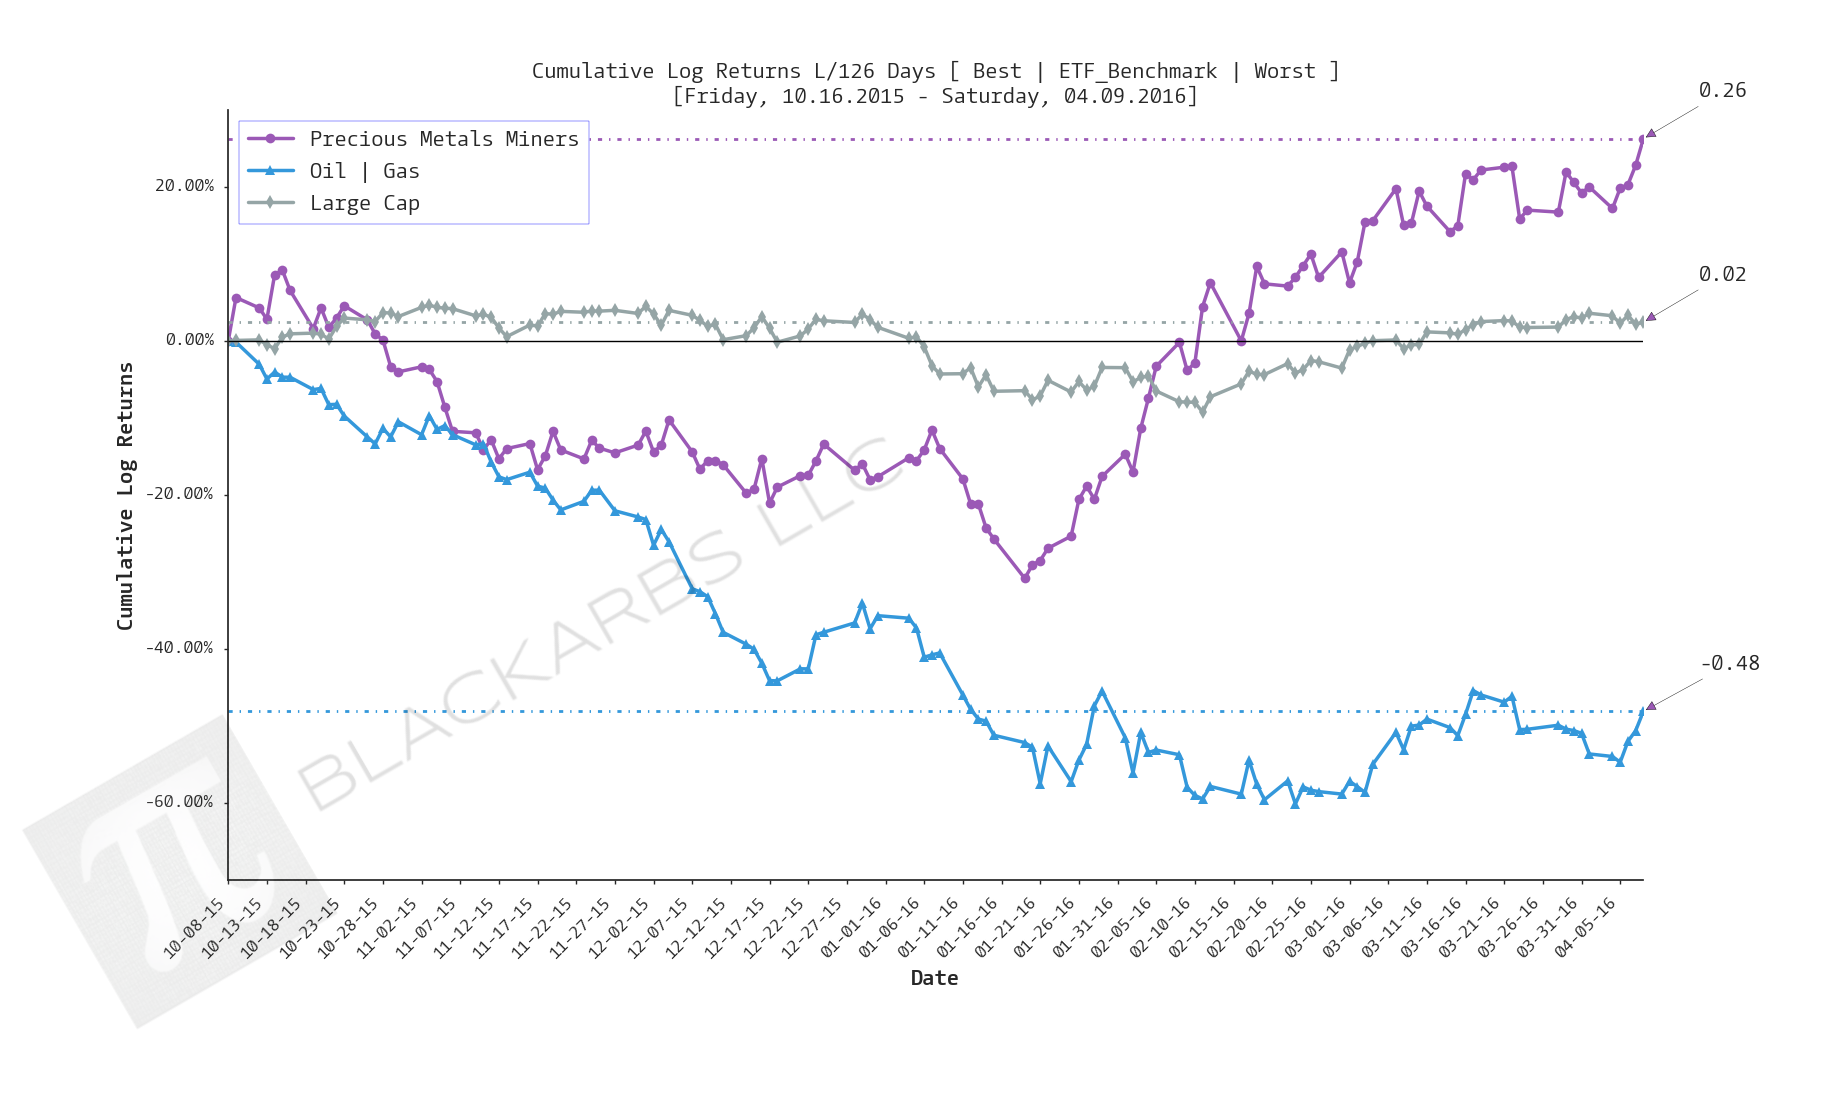
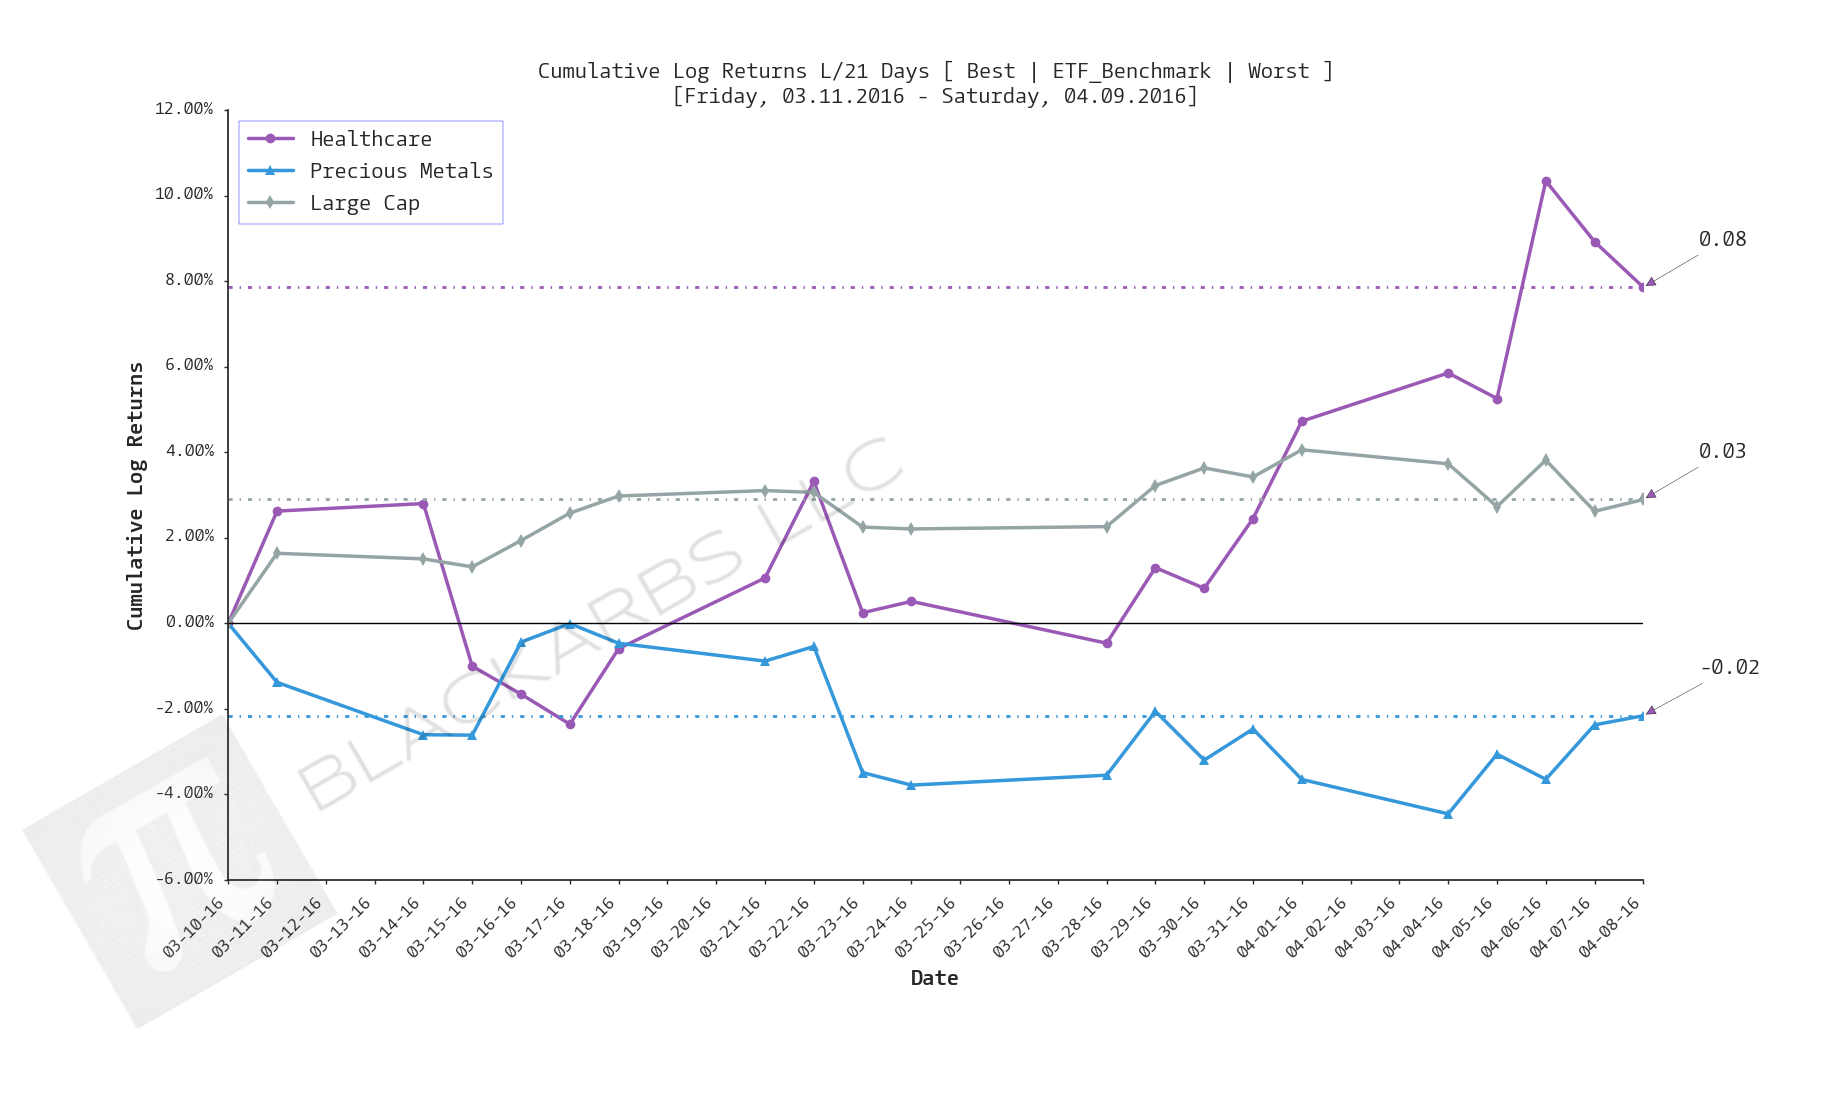
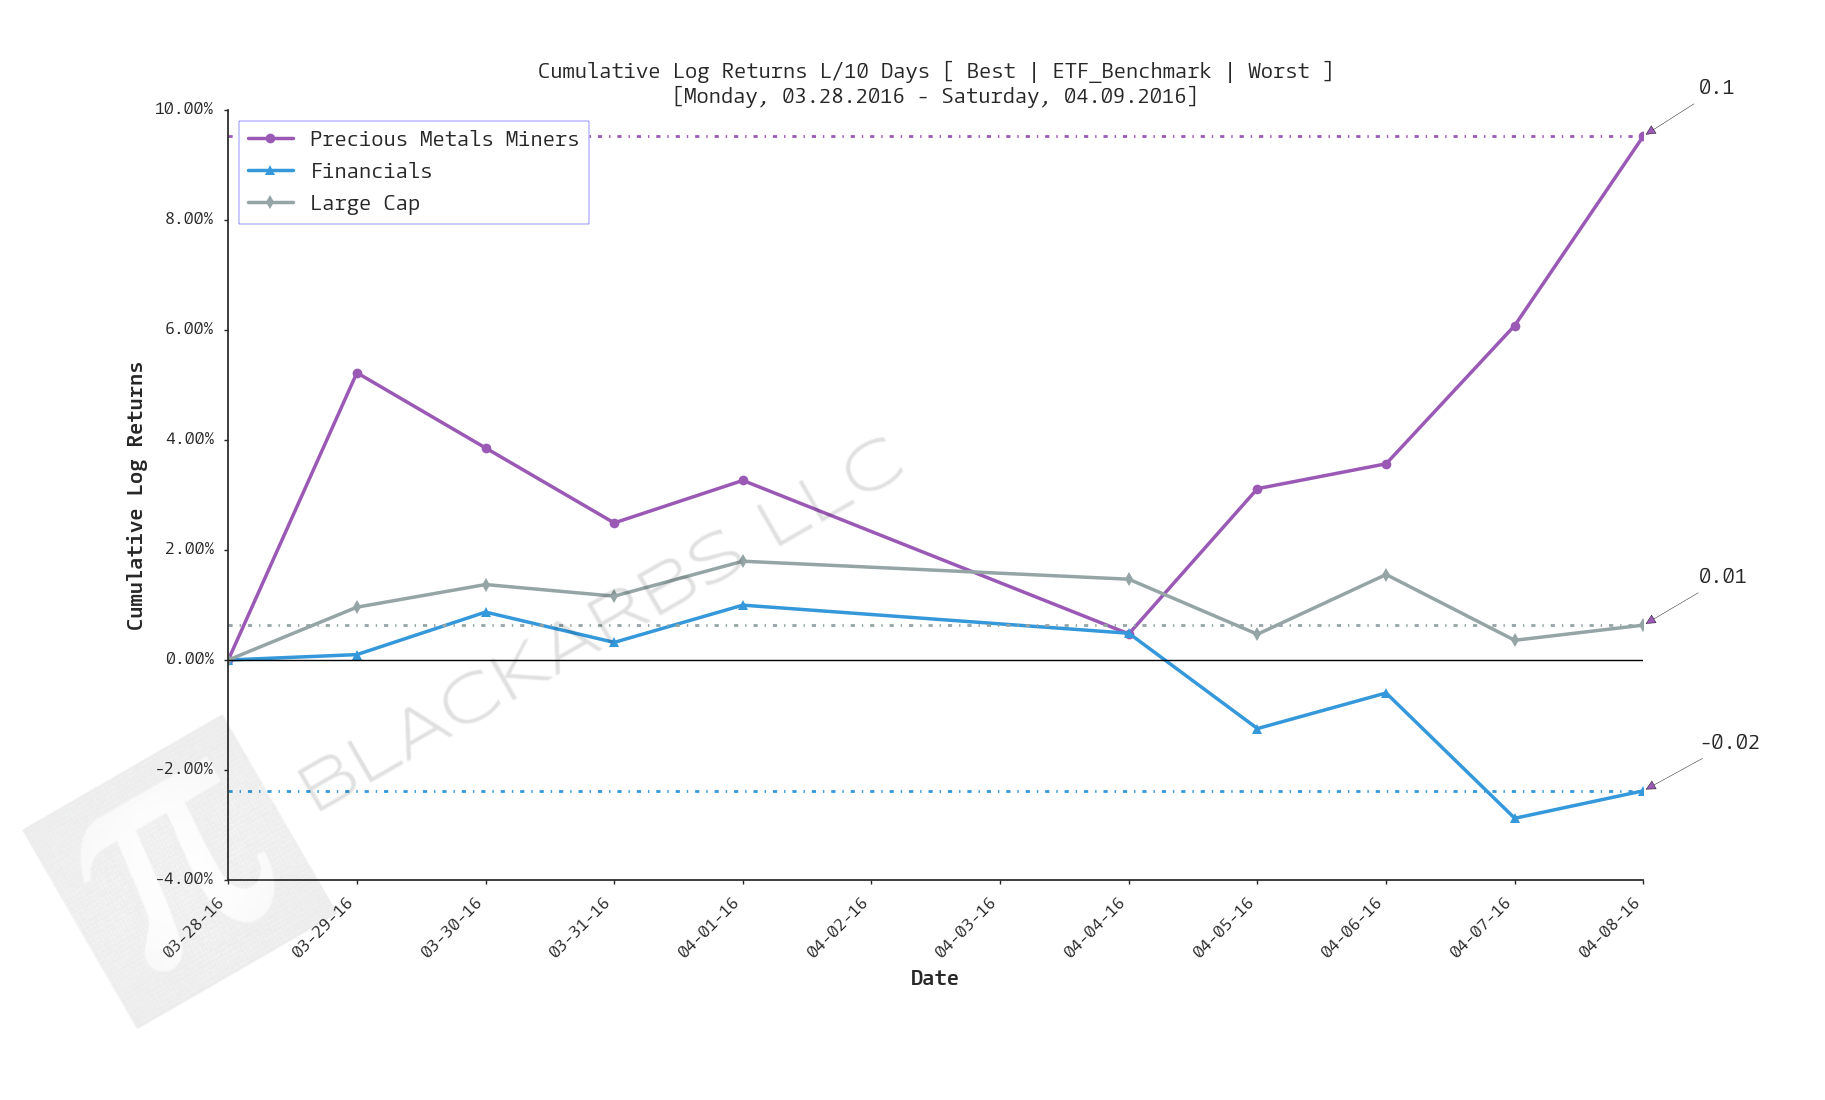
Composite ETF Cumulative Returns Line plot
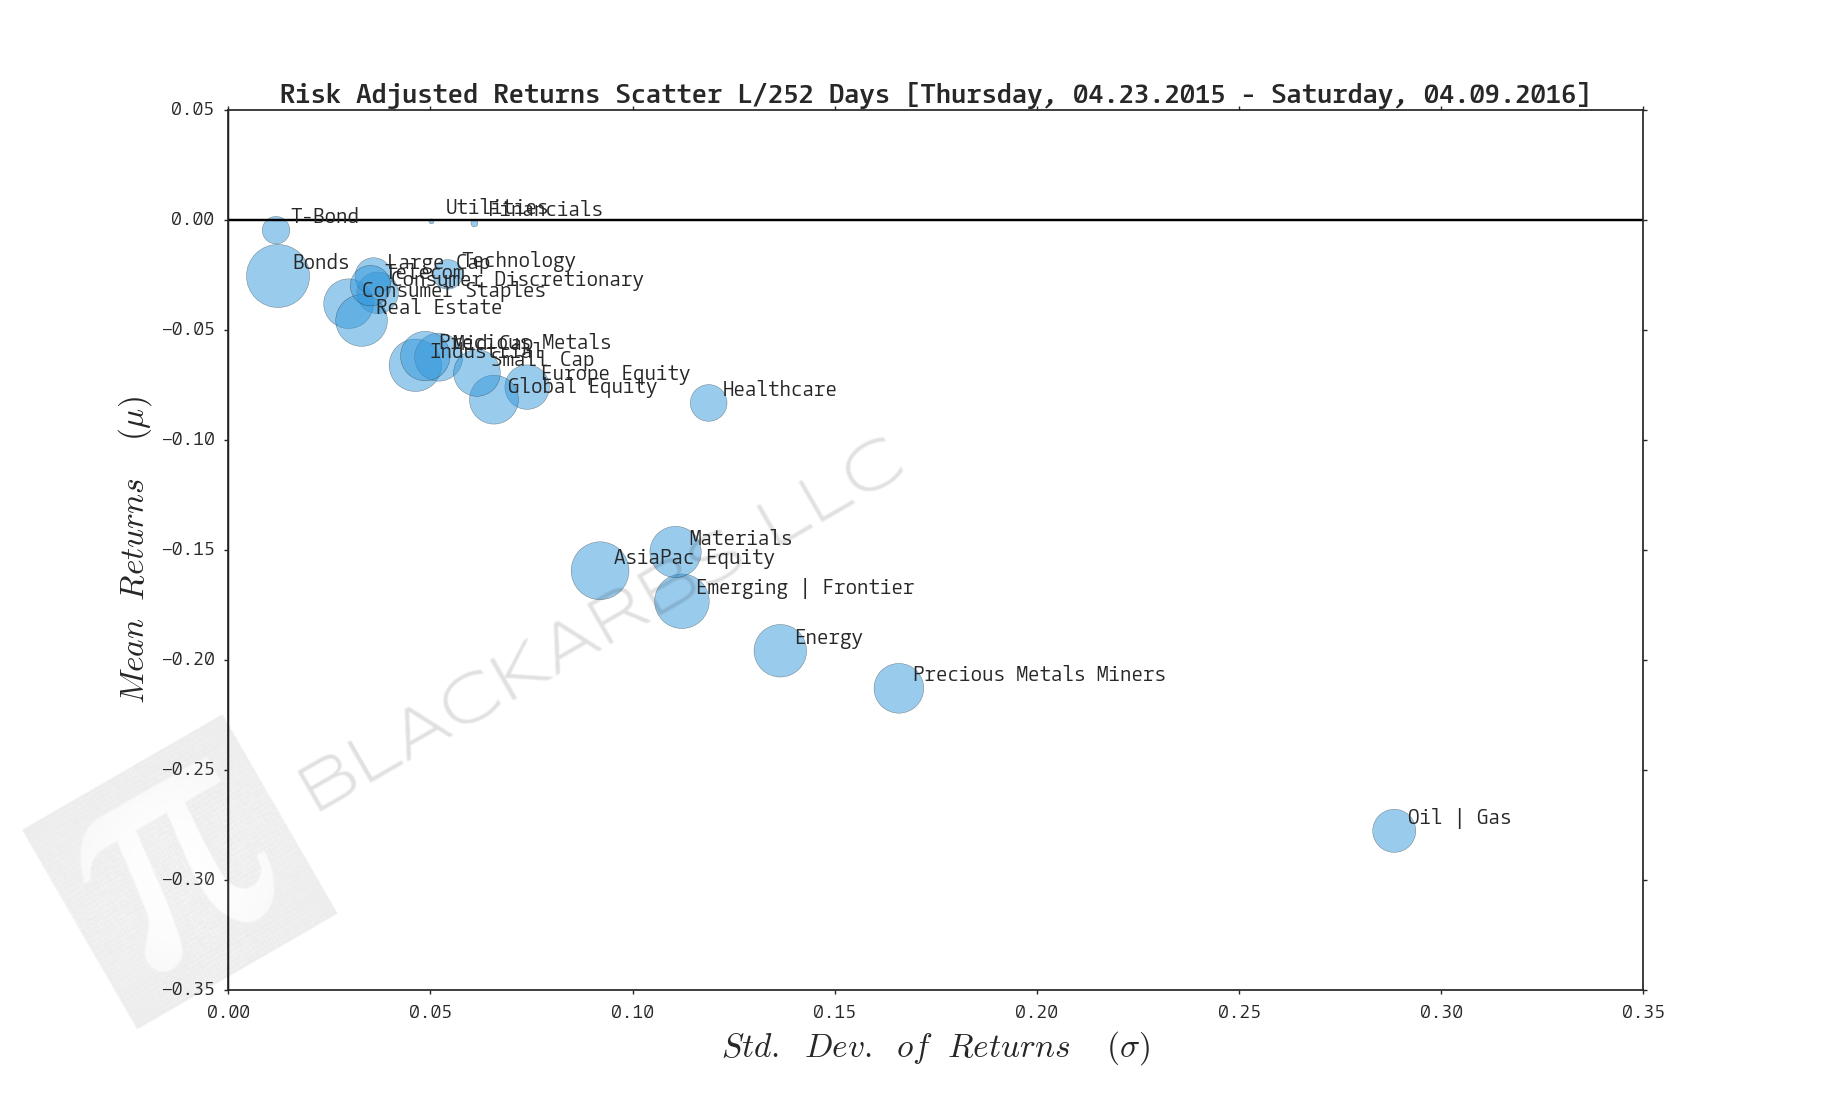
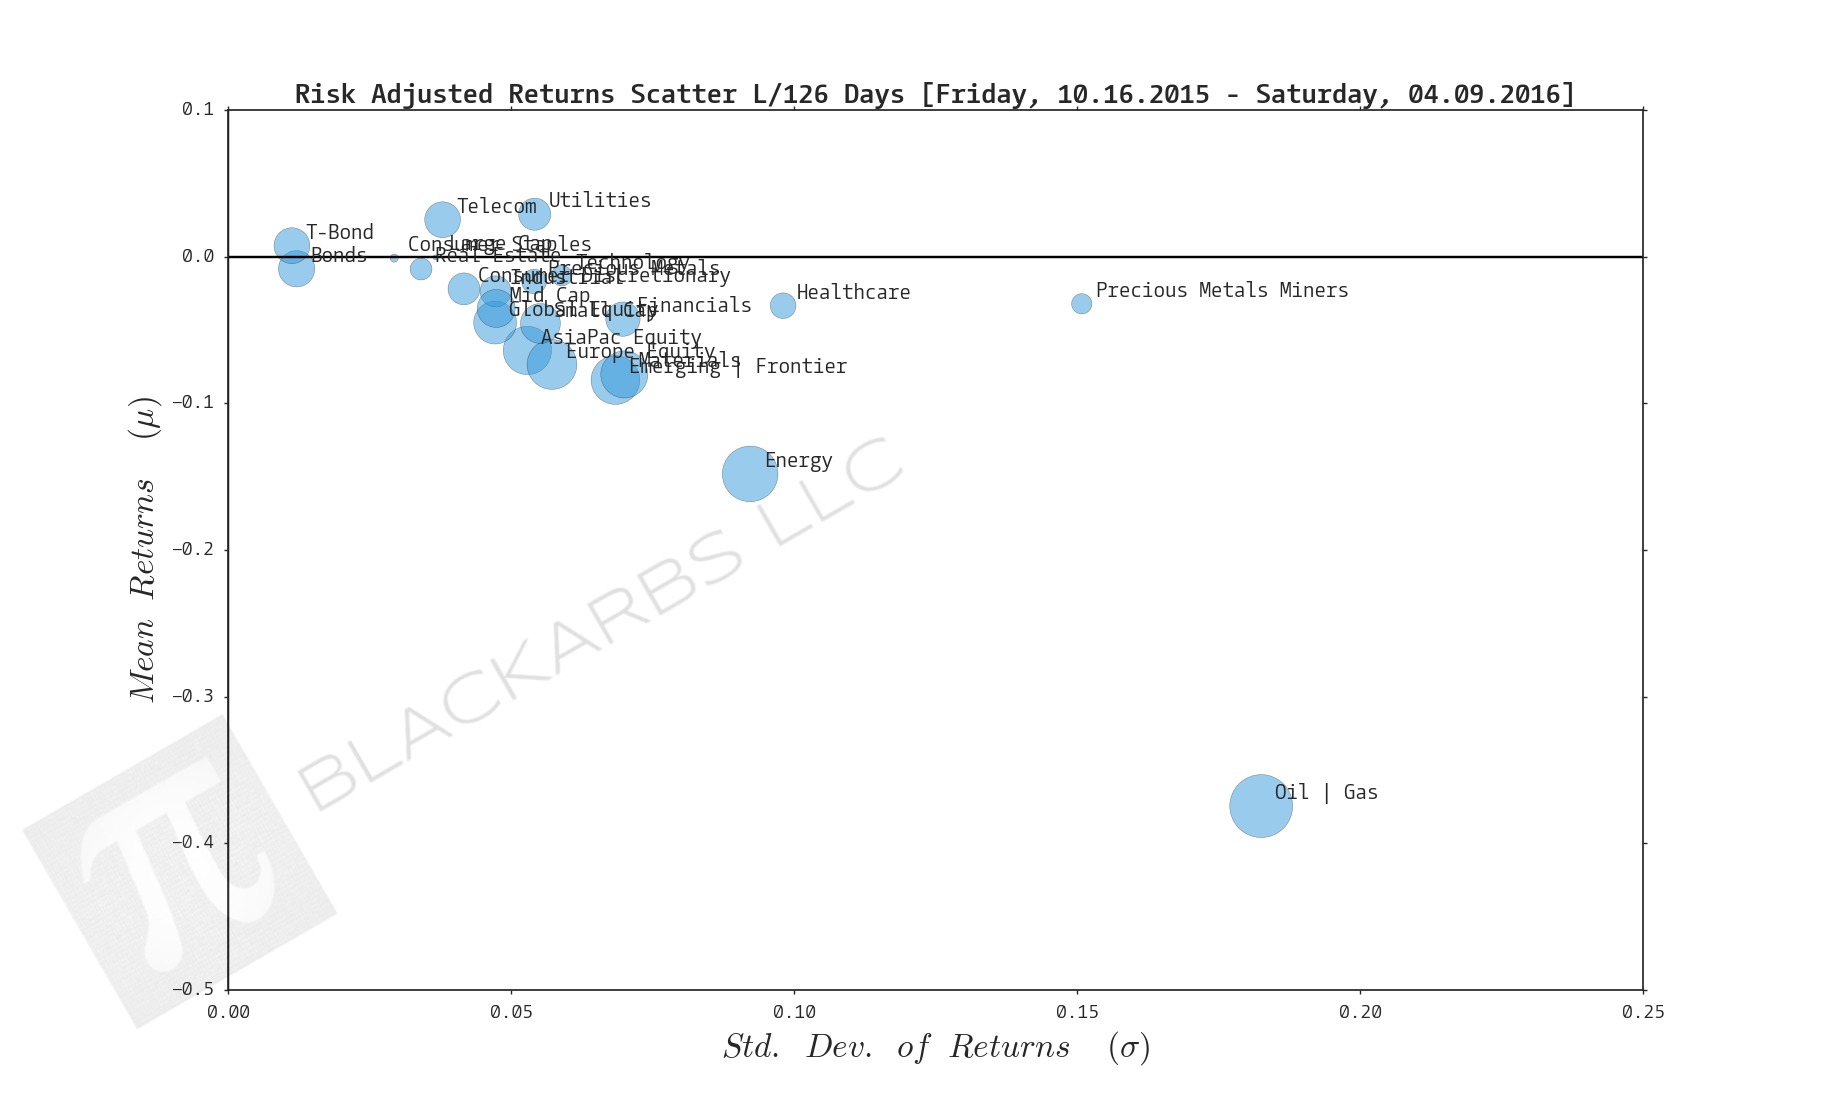
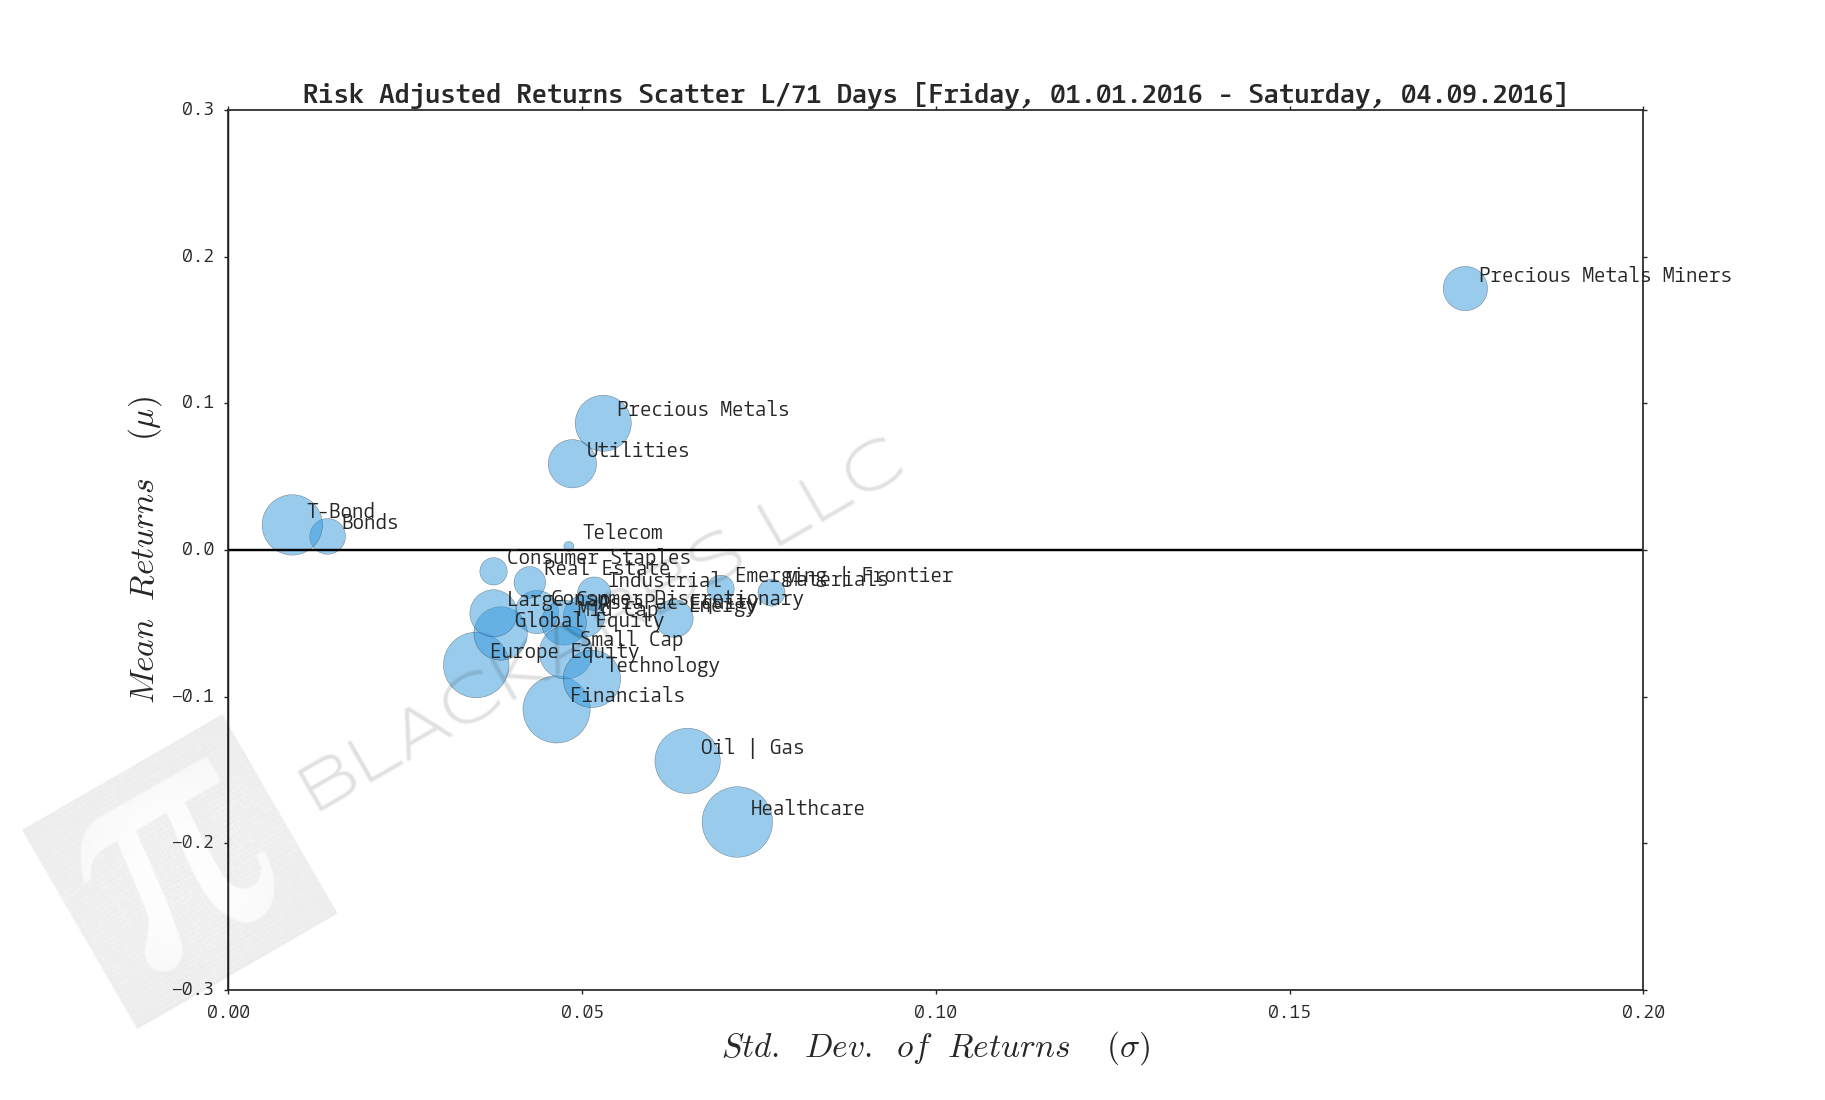
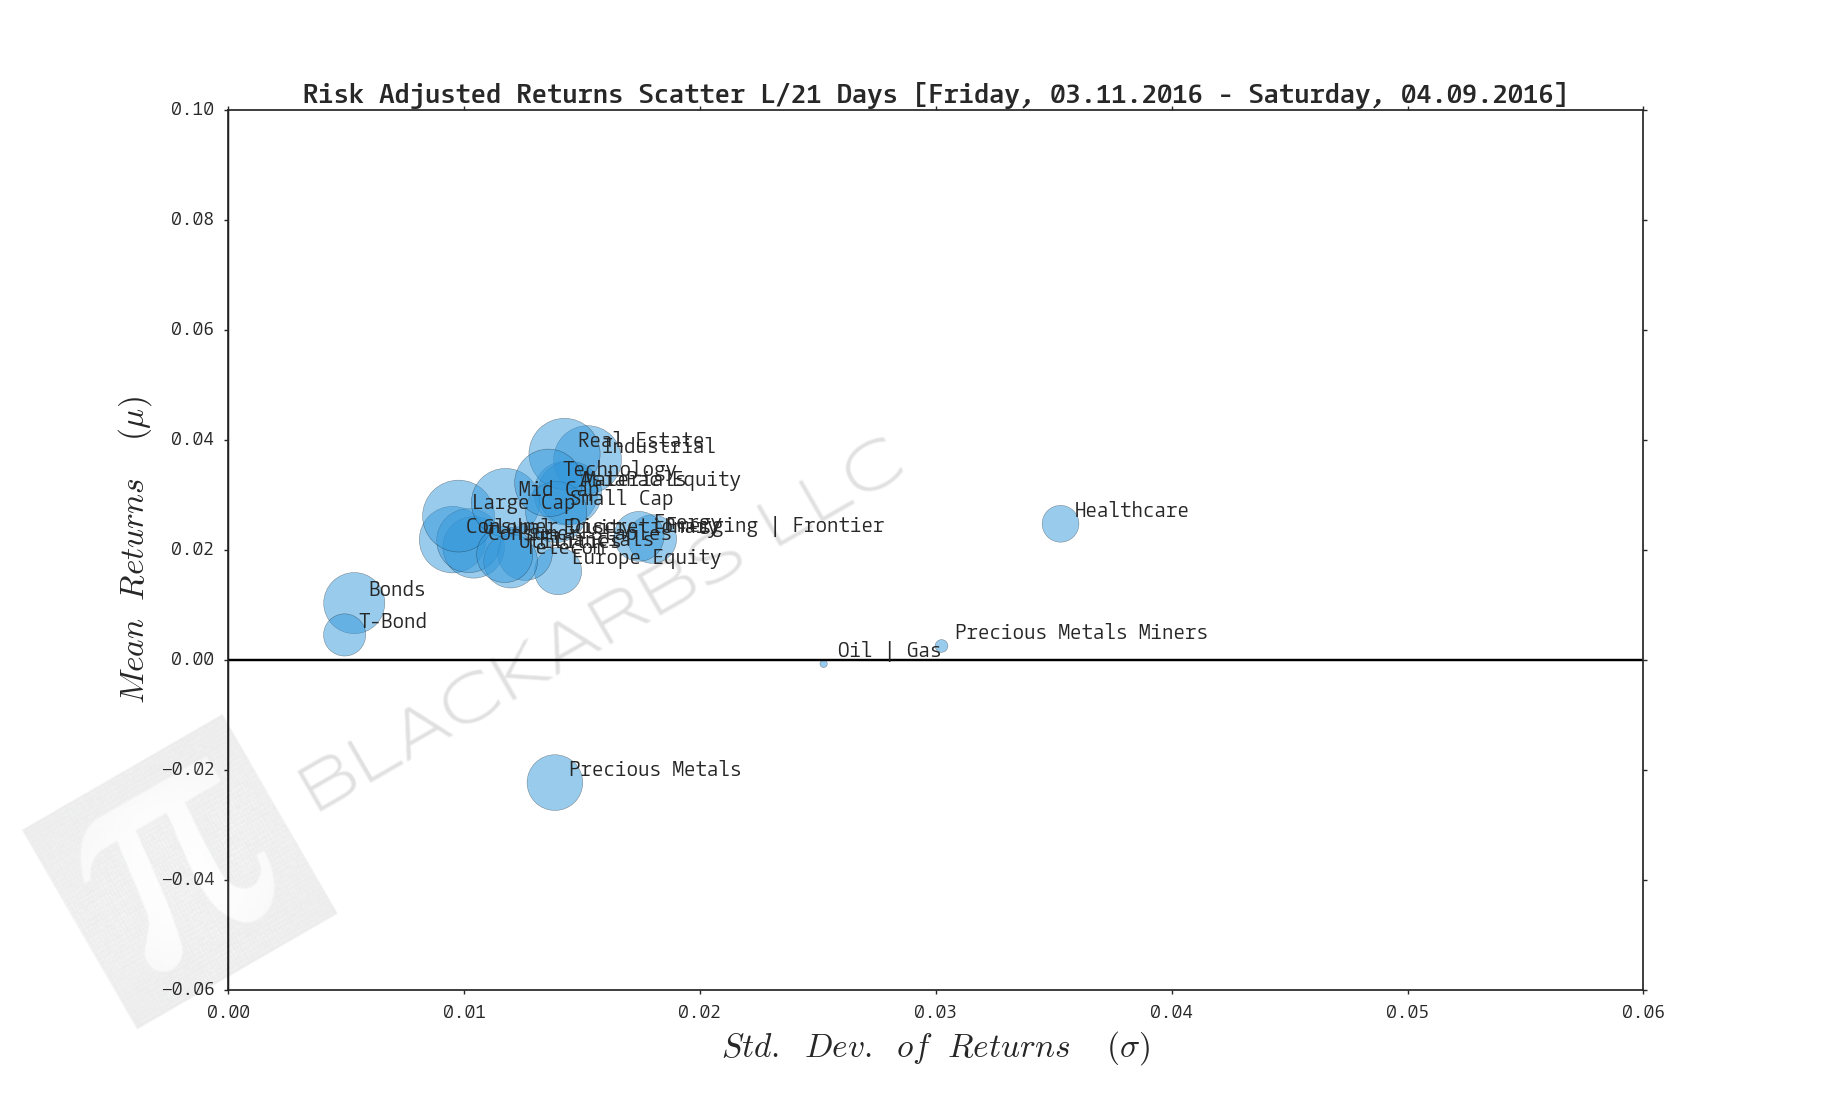
Composite ETF Risk-Adjusted Returns Scatter plot (Std vs Mean)
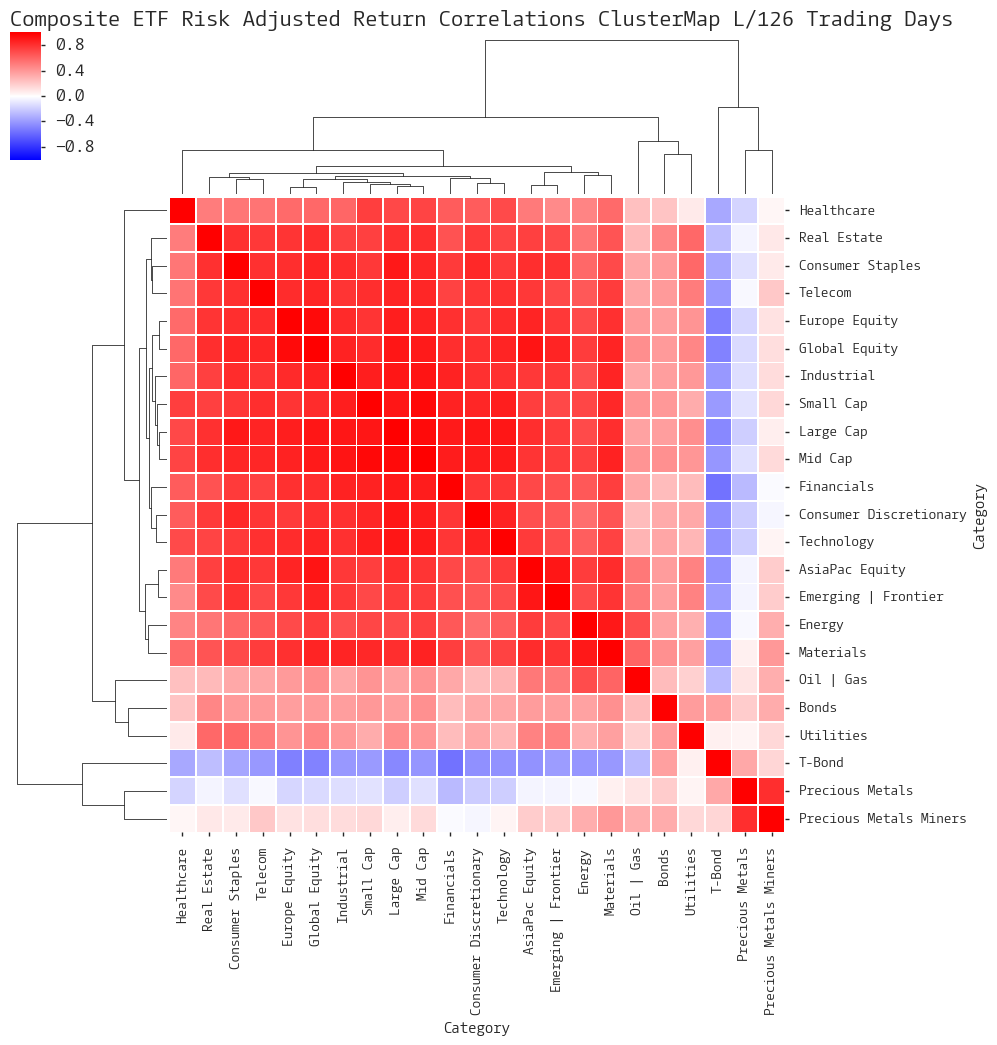
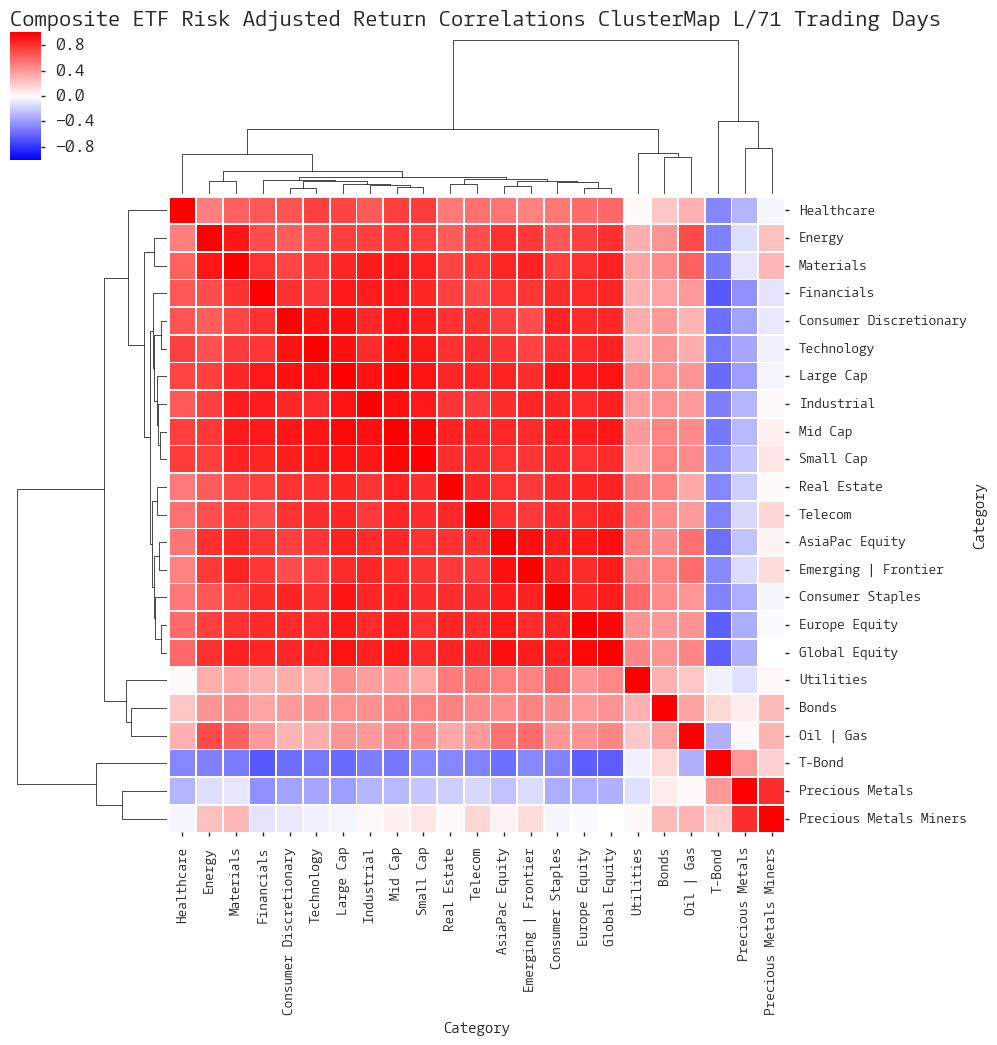
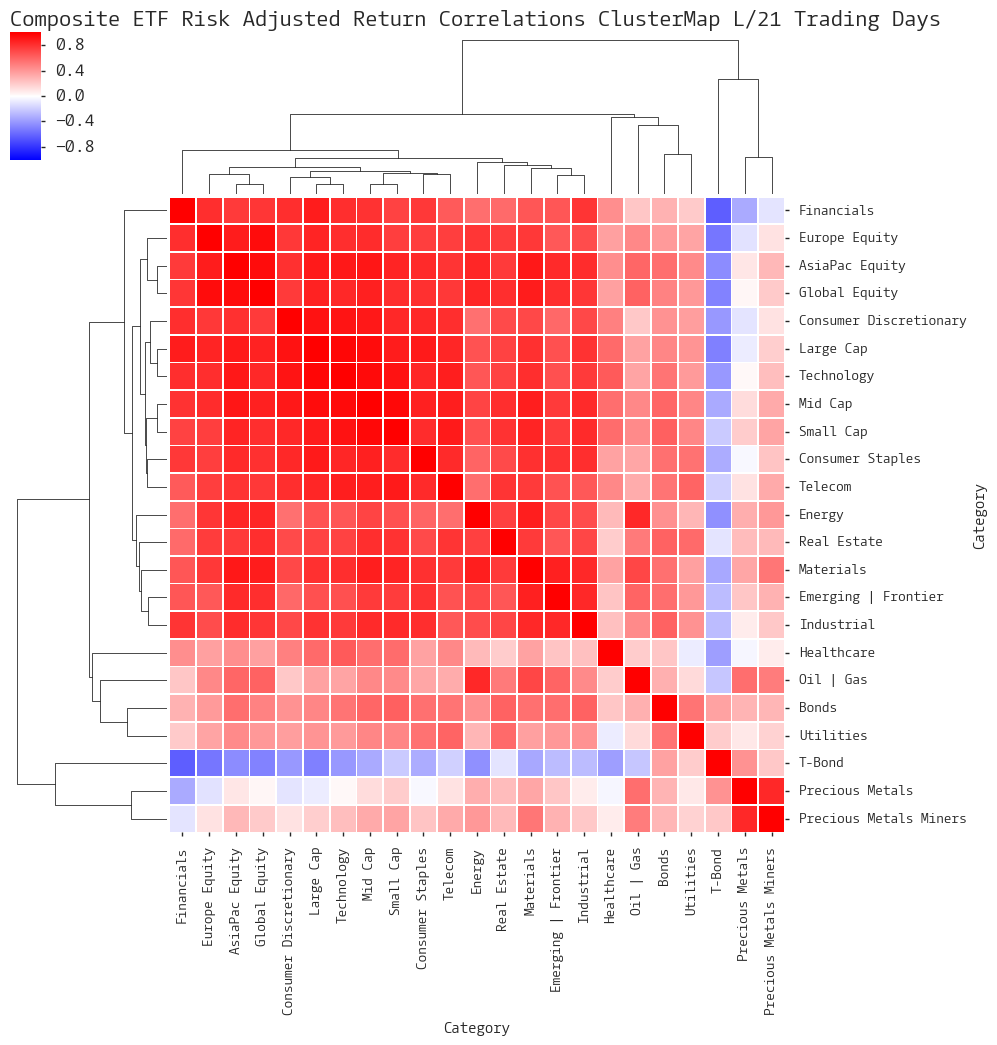
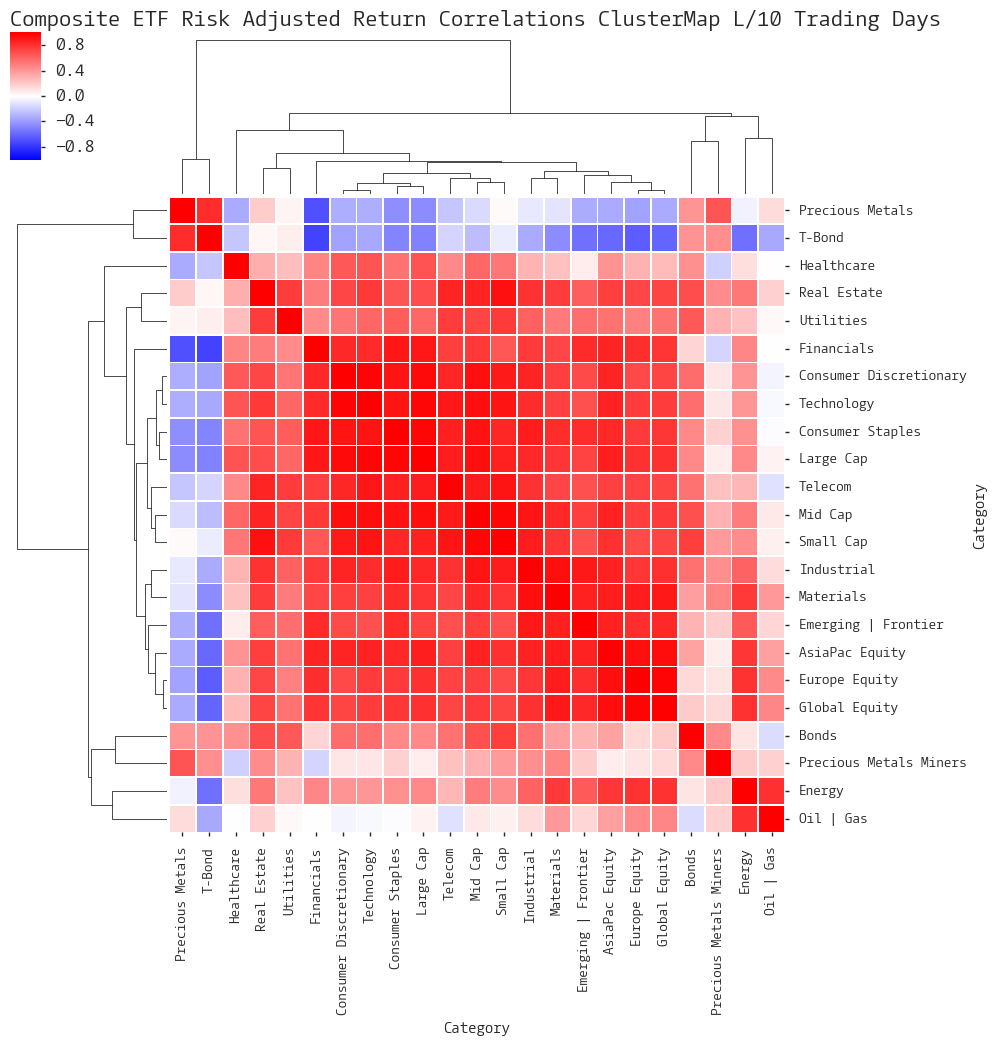
Composite ETF Risk-Adjusted Return Correlations Heatmap (Clusterplot)
Implied Cost of Capital Estimates
Composite ETF Cumulative Return Tables
Notable Trends and Observations
COMPOSITE ETF COMPONENTS:
LAST 252 TRADING DAYS

LAST 126 TRADING DAYS
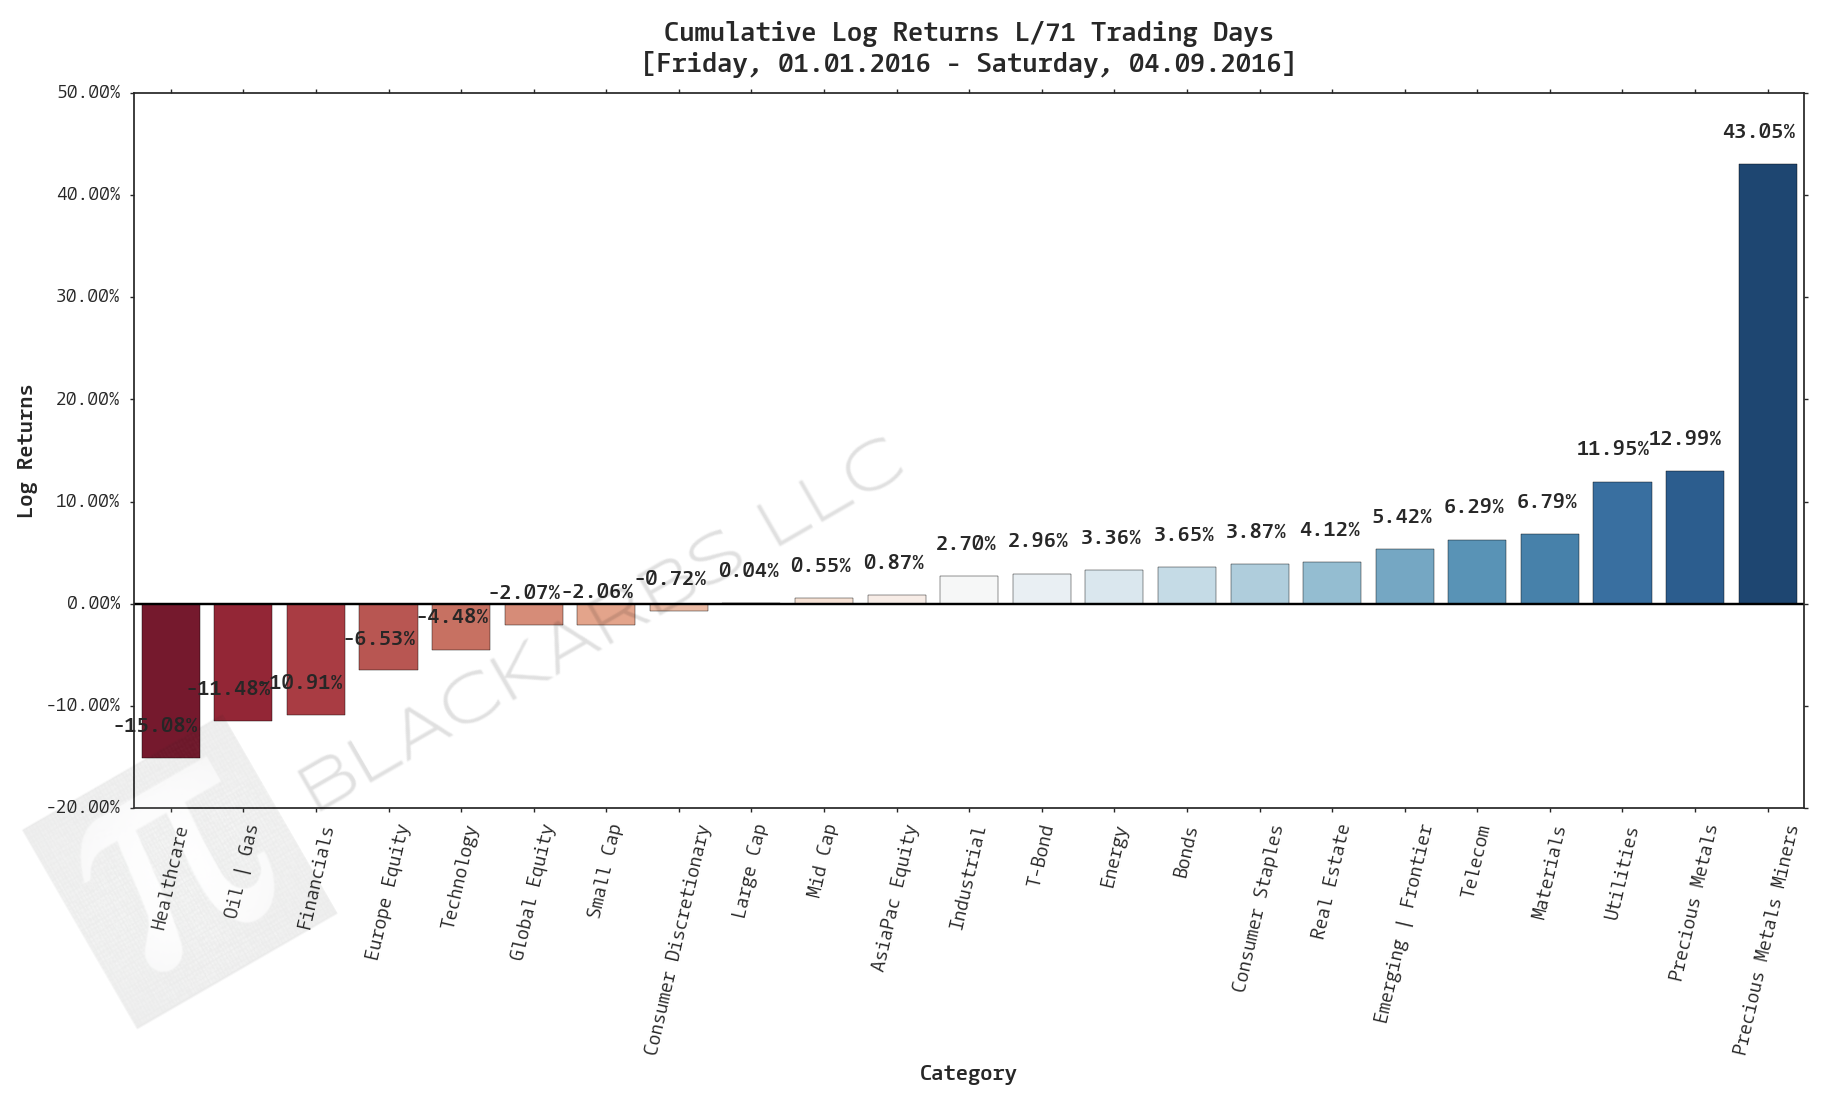
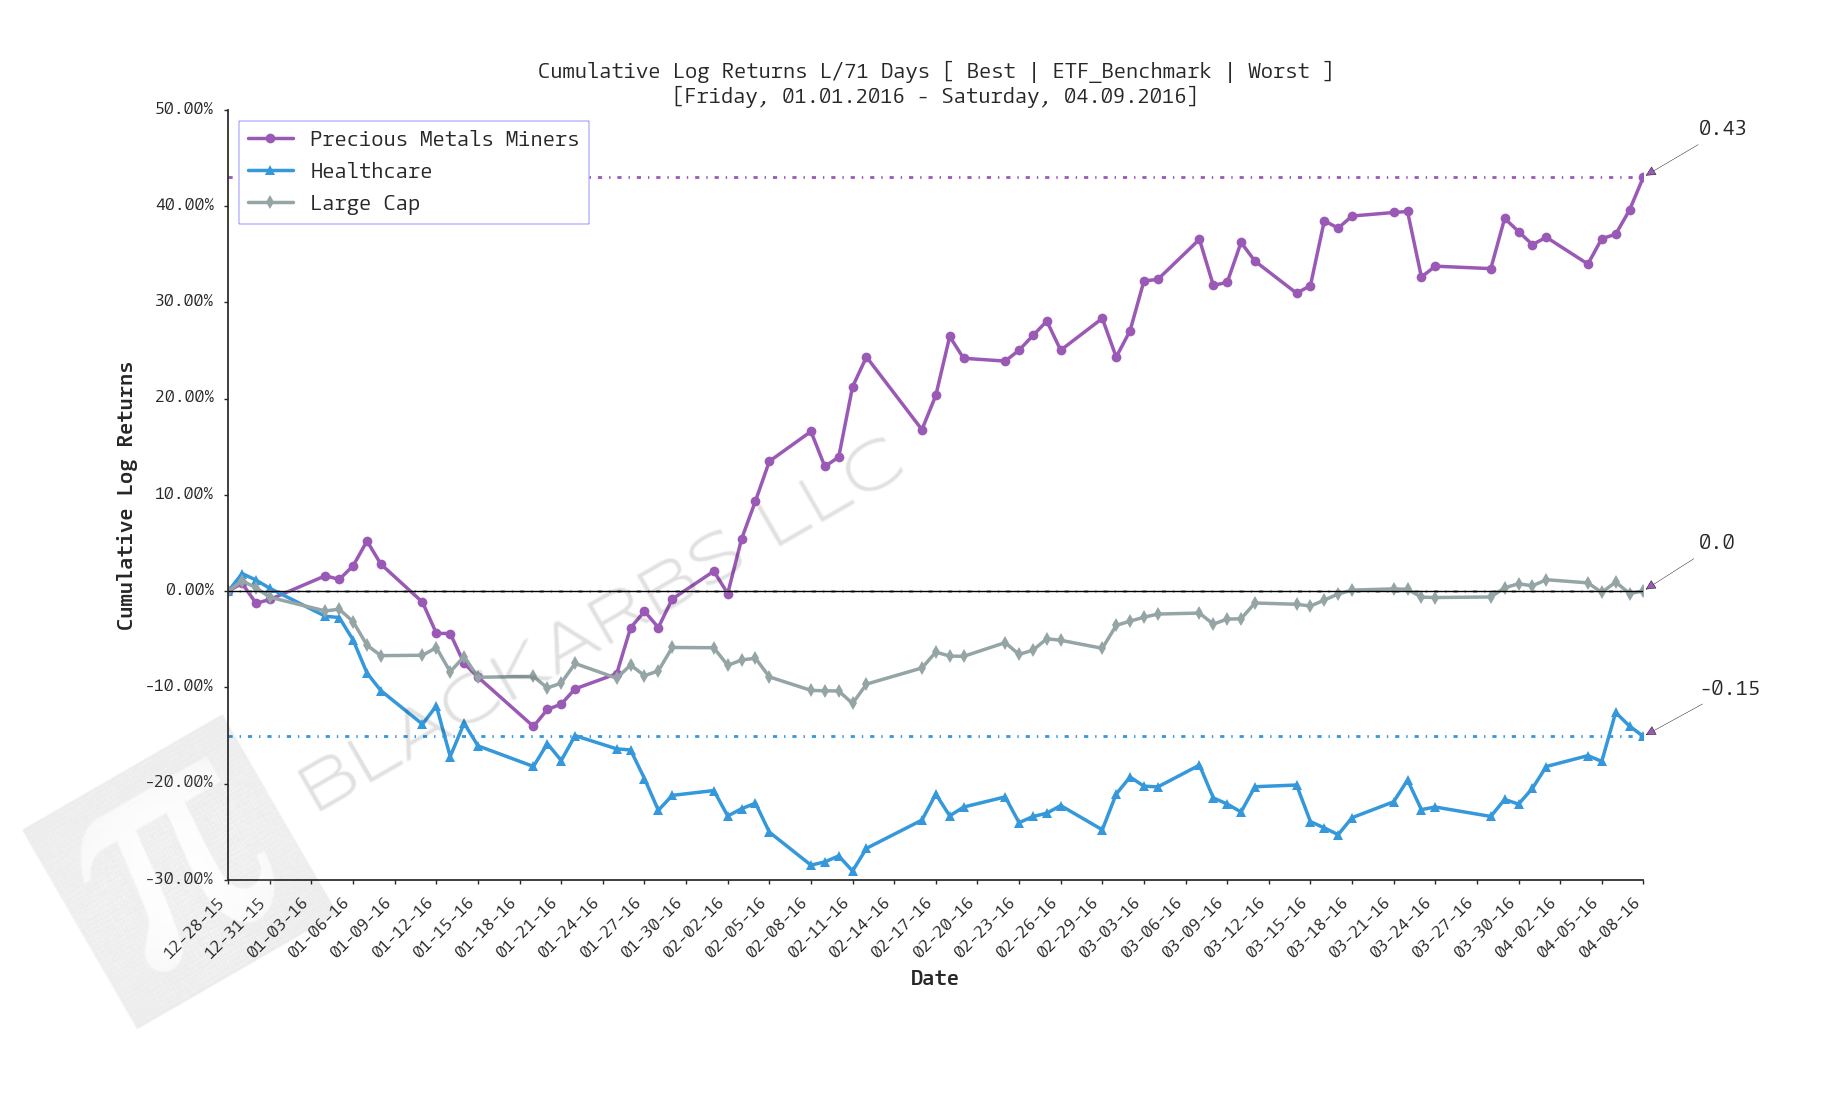
Year-to-Date LAST 71 TRADING DAYS
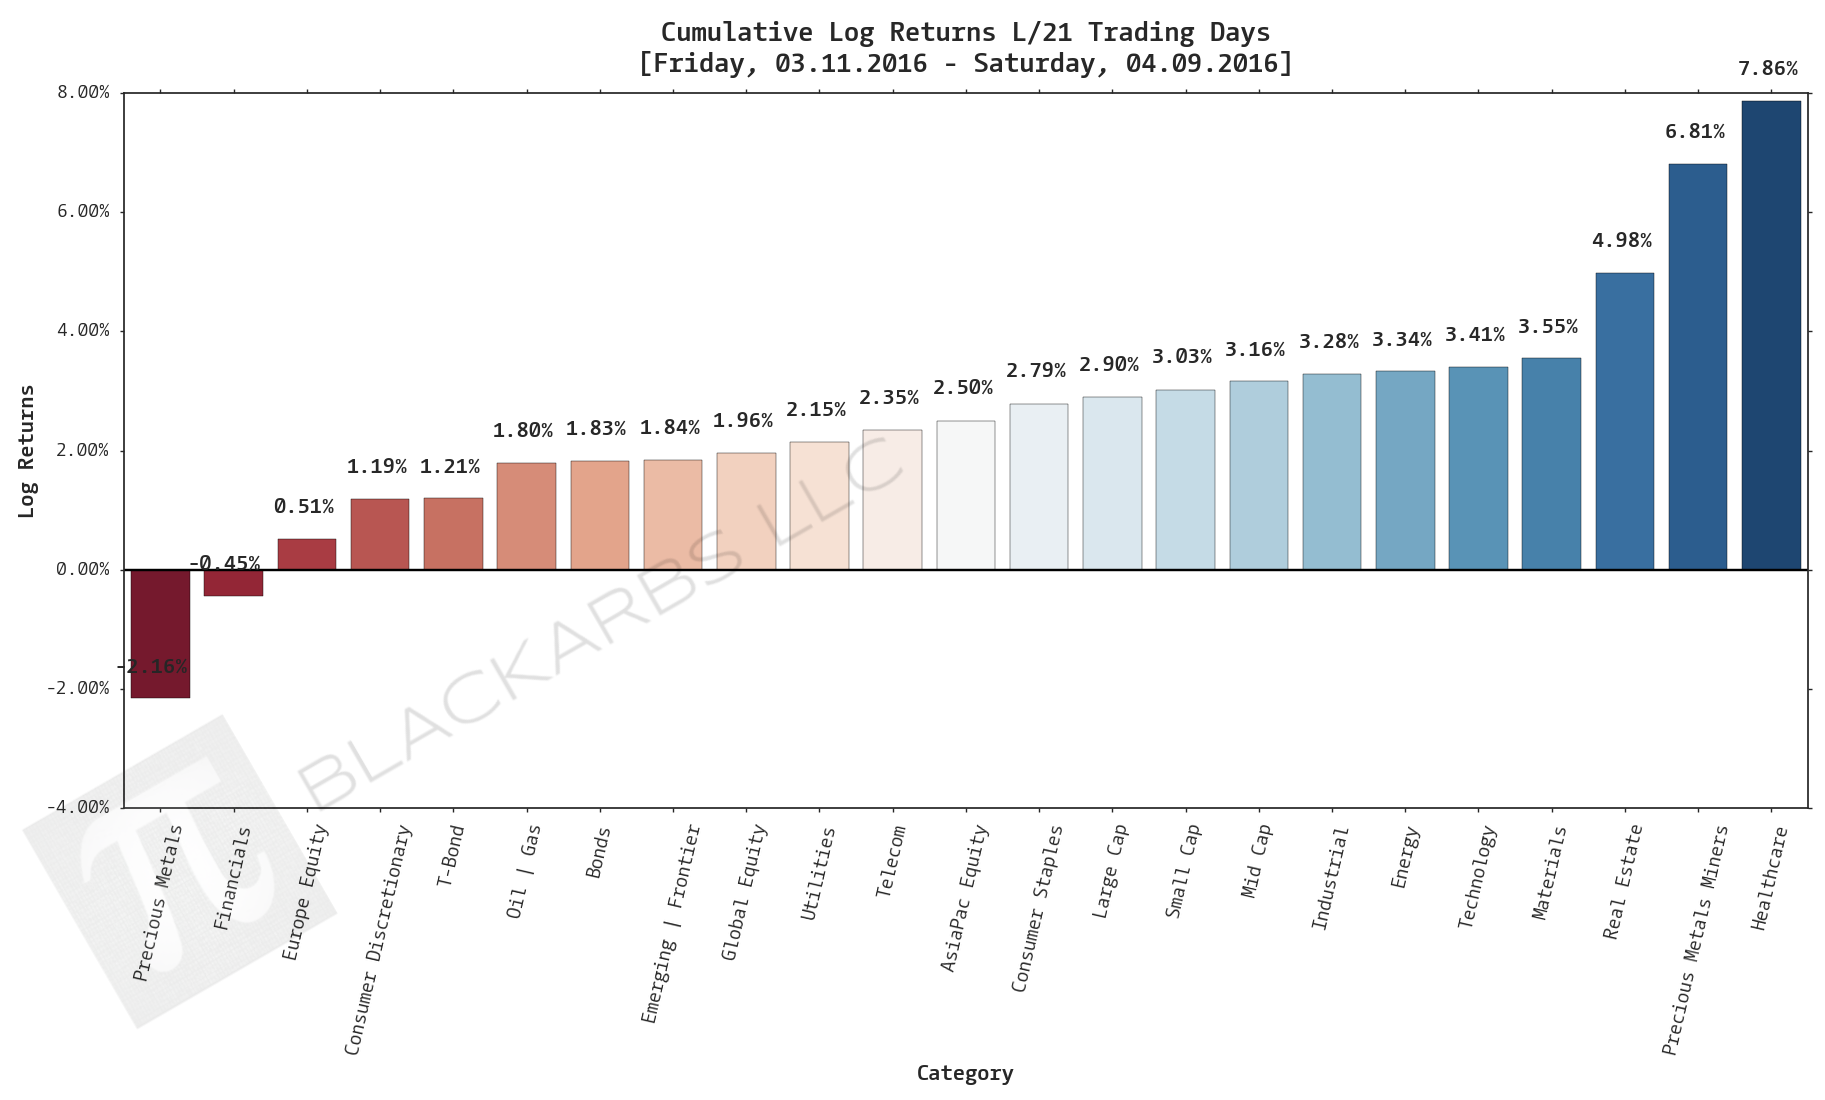
LAST 21 TRADING DAYS
LAST 10 TRADING DAYS

Implied Cost of Capital Estimates:
To learn more about the Implied Cost of Capital see here.
CATEGORY AVERAGE ICC ESTIMATES
ALL ETF ICC ESTIMATES BY CATEGORY
CUMULATIVE RETURN TABLES:
Notable Observations and Trends:
- L/252 days the top 4 performing composites have a risk-off/defensive 'tilt': (1) Utilities (2) Telecom (3) T-Bond (4) Precious Metals Miners (PMM).
- L/252 and L/126 the Large Cap composite is almost unchanged at ~1% and ~2% respectively.
- L/252 the correlation clustermap (dendrogram) groups T-Bond, Bonds, Precious Metals (PM), and PMM as most closely correlated. Based on the data this grouping has offered the most diversification vs the remaining composites.
- YTD L/71 days the top 3 performers are PMM, PM, and Utilities. PMM is trending strongly over the period gaining over 43%.
- L/21 and L/10 days Healthcare, PMM, and real estate have been the strongest performers.
- Financials appear to be trending negatively over the L/71, L/21 and L/10 days. The composite has been a bottom 3 performer across timeframes. This is likely related to the Fed signaling the pace of interest rate increases should be slower than expected.
