COMPOSITE MACRO ETF WEEKLY ANALYTICS (2/27/2016)
/FOR A DEEPER DIVE INTO ETF PERFORMANCE AND RELATIVE VALUE SUBSCRIBE TO THE ETF INTERNAL ANALYTICS PACKAGE HERE
LAYOUT (Organized by Time Period):
Notable Trends and Observations
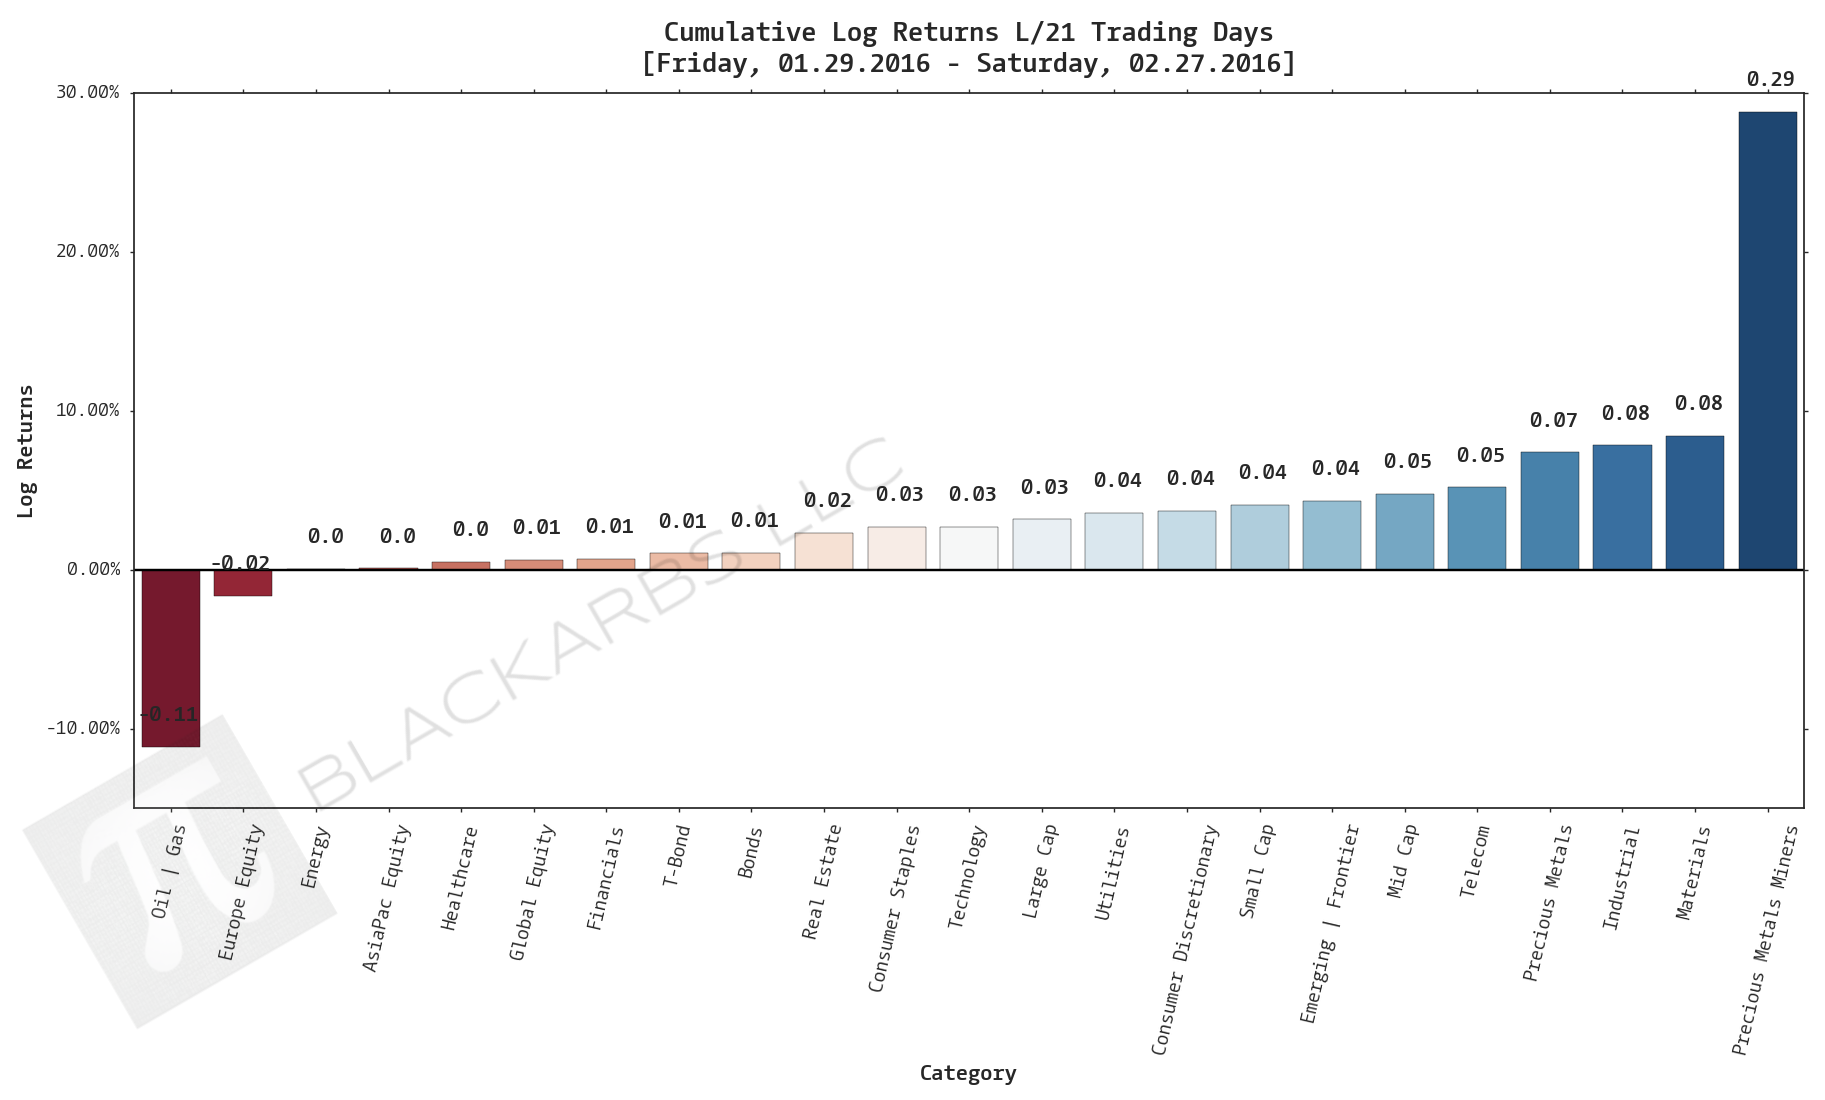
Composite ETF Cumulative Returns Momentum Bar plot
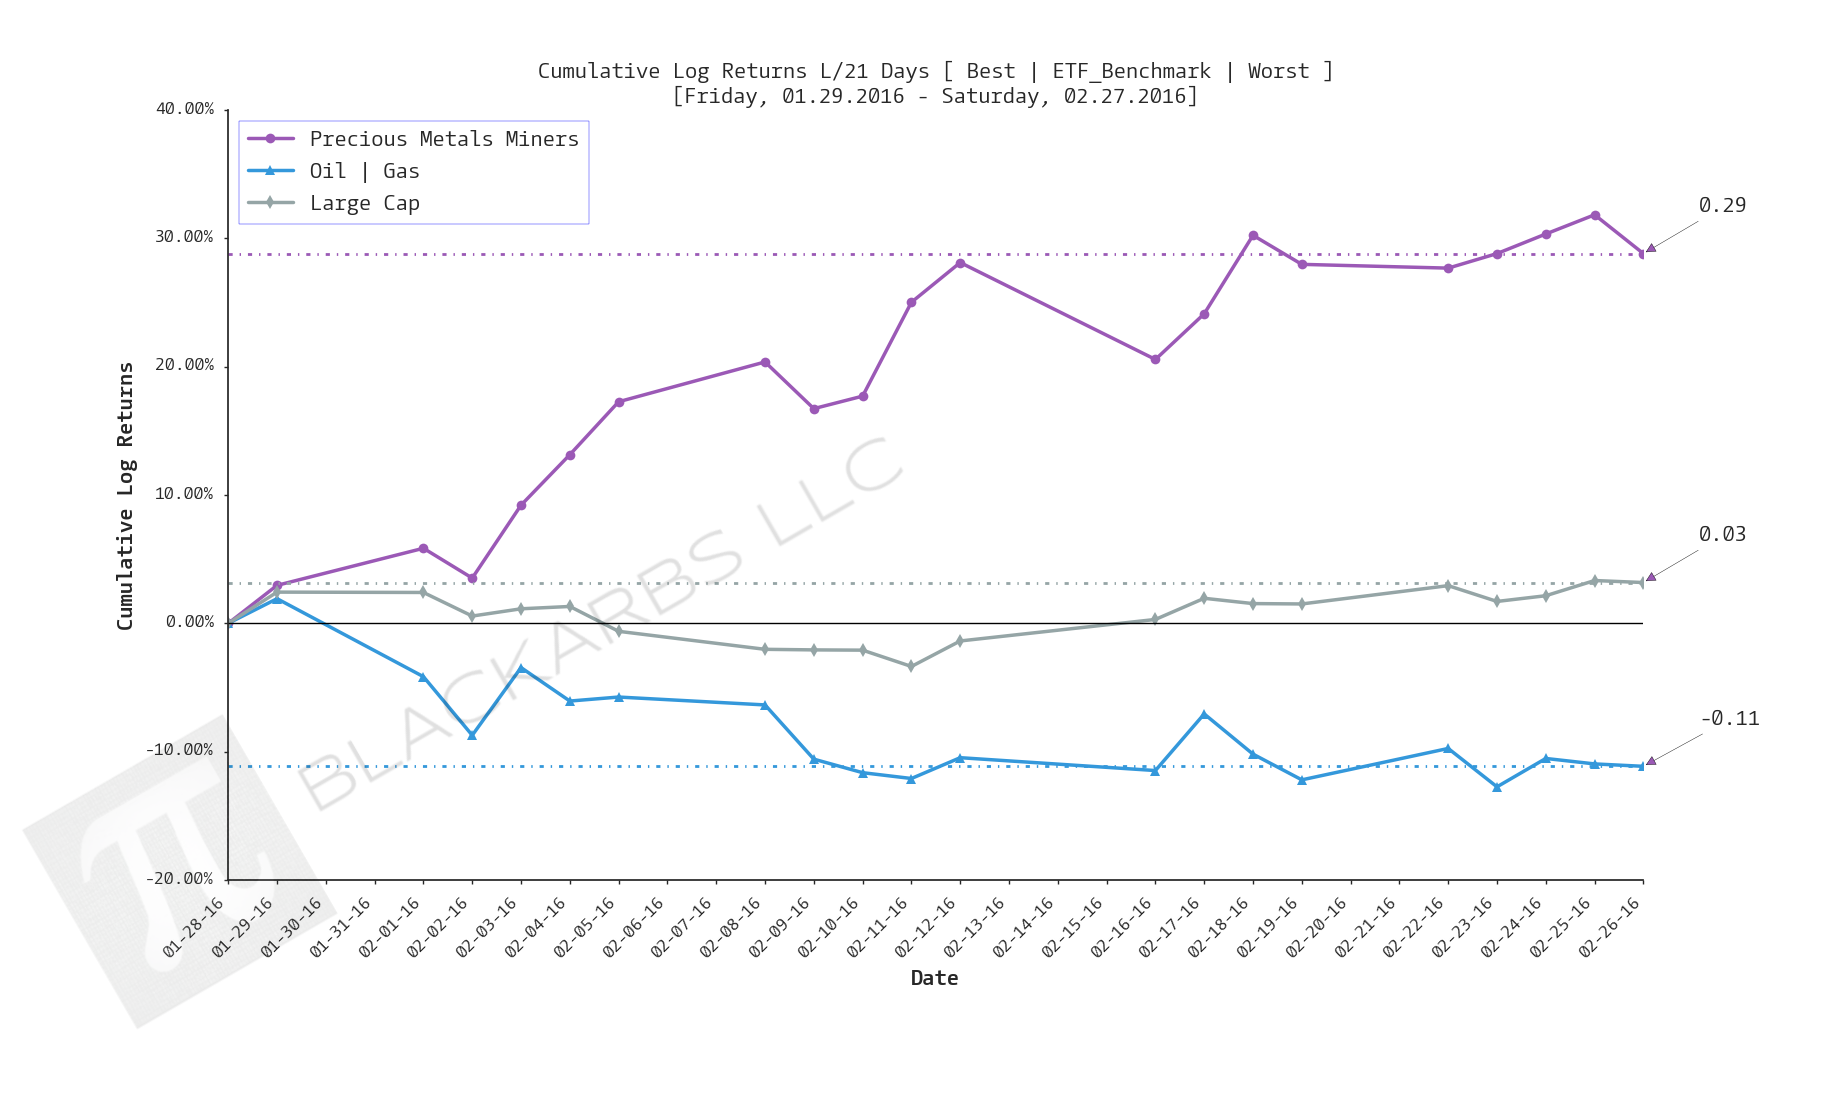
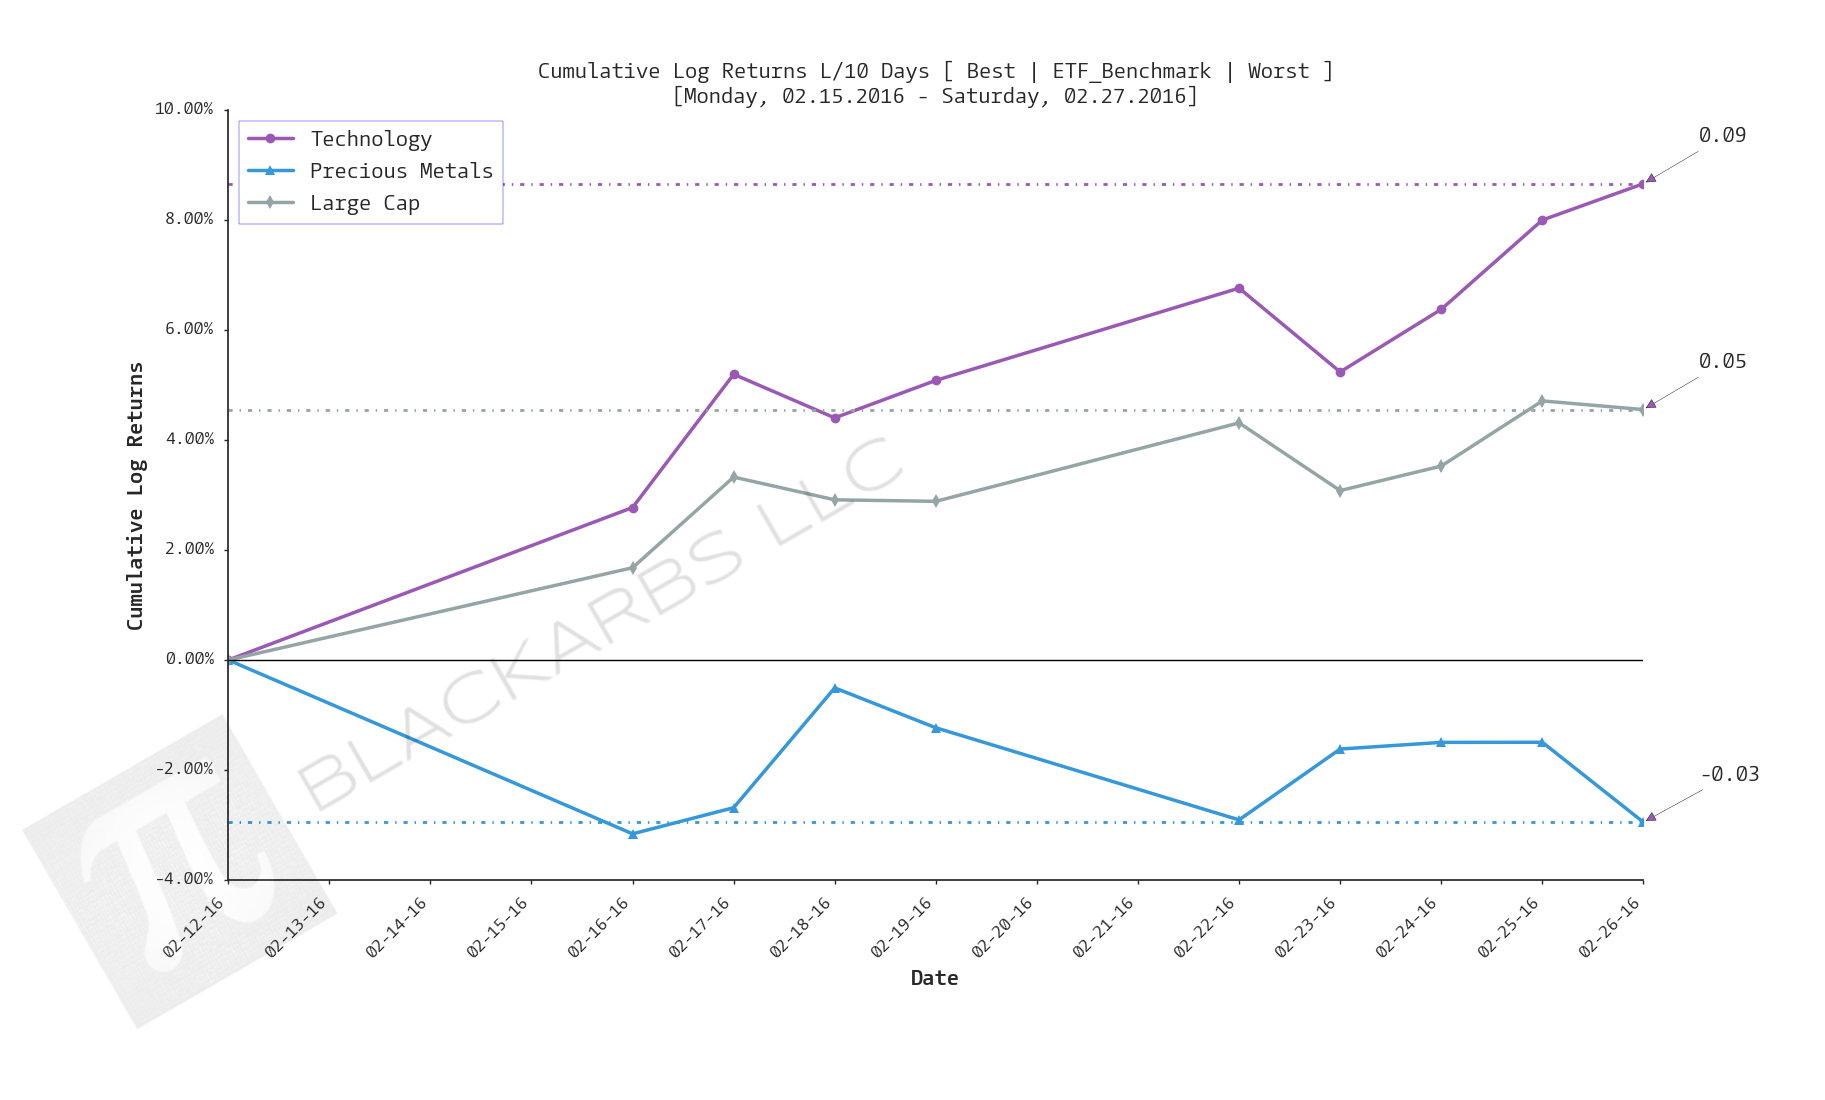
Composite ETF Cumulative Returns Line plot
Composite ETF Risk-Adjusted Returns Scatter plot (Std vs Mean)
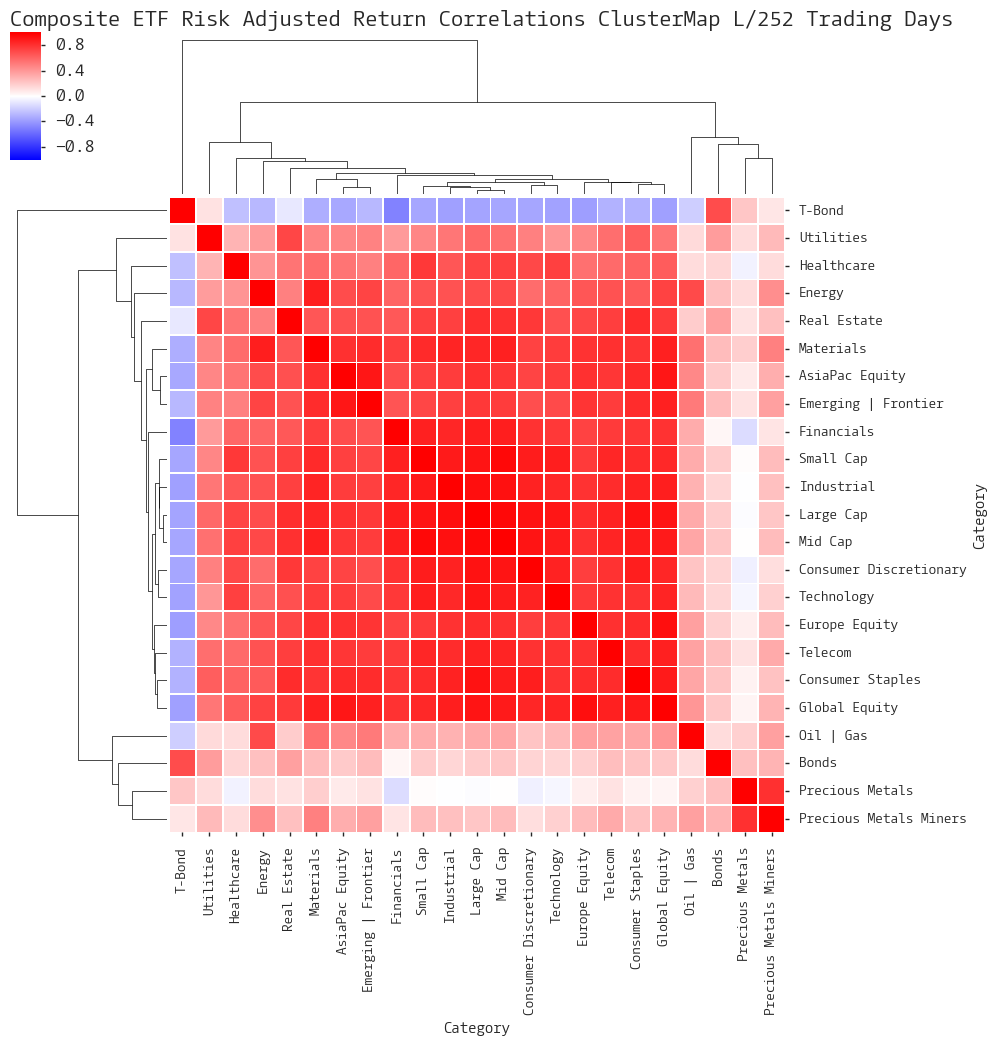
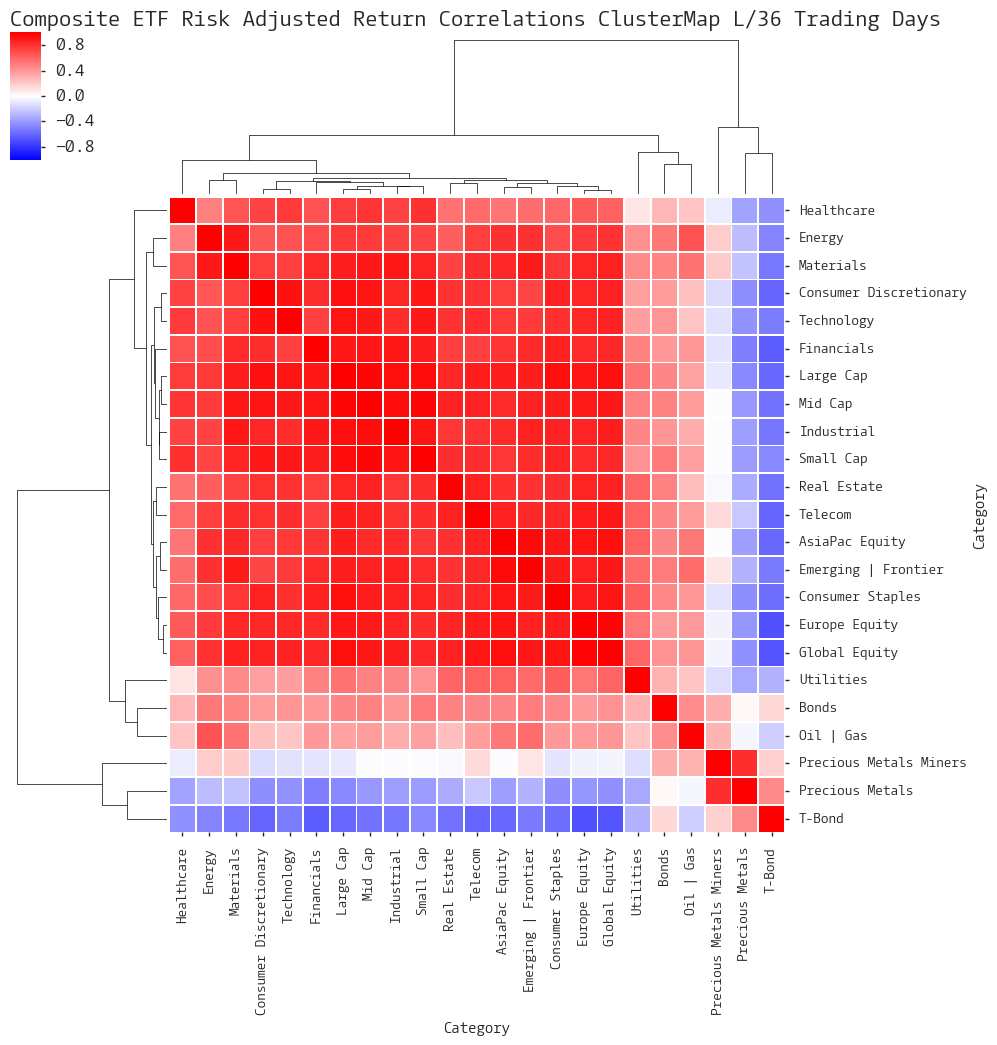
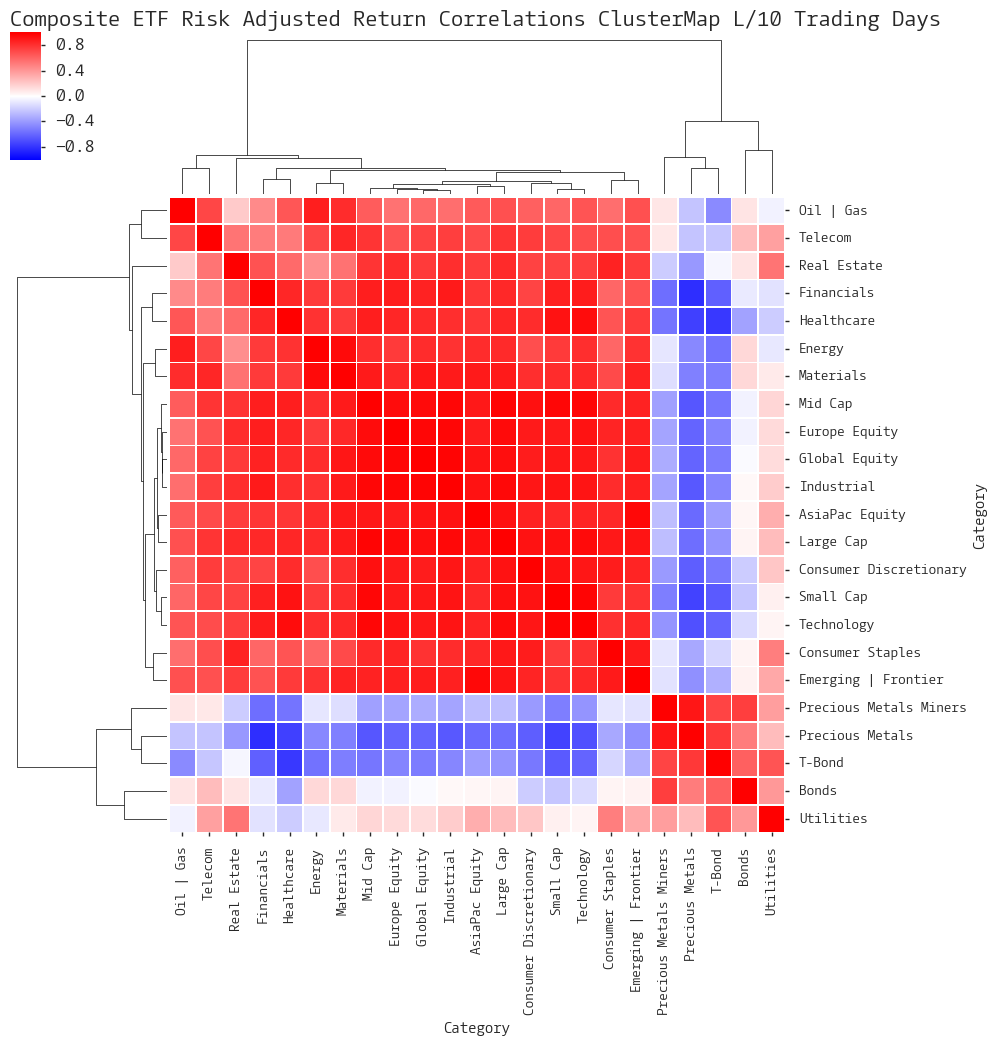
Composite ETF Risk-Adjusted Return Correlations Heatmap (Clusterplot)
Implied Cost of Capital Estimates
Composite ETF Cumulative Return Tables
COMPOSITE ETF COMPONENTS:
Notable Observations and Trends:
- Cumulative returns across a broad spectrum of composites remain weak evidenced by only Utilities and Treasuries showing gains over the last 252 days.
- Mid January appears to be a major turning point/trend change for the Precious Metals Miners composite. Looking at the last 126 days Best/Worst plot shows a sharp V bounce which has continued since.
- Investors positioning still looks defensive over the longer frames of 252, 126, 63 days as evidenced by the outperformance of the Precious Metals complex, Utilities, and Treasuries.
- The market overall still looks binary (risk-on/risk-off) as evidenced by the increase in inverse correlations across timeframes between risk assets (sectors, global, emerging equity) and defensive assets (precious metals, bonds, utilities, telecom) .
LAST 252 TRADING DAYS


LAST 126 TRADING DAYS


LAST 63 TRADING DAYS


YEAR-TO-DATE LAST 41 TRADING DAYS


LAST 21 TRADING DAYS


LAST 10 TRADING DAYS


Implied Cost of Capital Estimates:
To learn more about the Implied Cost of Capital see here.