USING IMPLIED VOLATILITY TO PREDICT ETF RETURNS (1/17/16)

To see the origin of this series click here

In the paper that inspired this series ("What Does Individual Option Volatility Smirk Tell Us About Future Equity Returns?") the authors' research shows that their calculation of the Option Volatility Smirk is predictive of equity returns up to 4 weeks. Therefore, each week, I will calculate the Long/Short legs of a portfolio constructed by following their criteria as closely as possible. However this study will focus on ETF's as opposed to single name equities. I will then track the results of the Long/Short portfolio, in equity returns, cumulatively for 4 weeks before rotating out of that portfolio. The ETF's are selected from the following groups:

PORTFOLIO ONE

Longs: XLF, EPI, VOX, XLI, XLP, XLV, HEDJ, IYT

Shorts: EZU, XLB, GDXJ, XRT, XHB, VGK, KRE, EWT

Week 1, Week 2, and Cumulative Results: 

PORTFOLIO TWO

Longs: VPU, IJR, FEZ, IWB, INDA, HEDJ, IYT

Shorts: LQD, EWW, IAU, VDE, EWT, EEM, EWH

Week 1 Results:

PORTFOLIO THREE

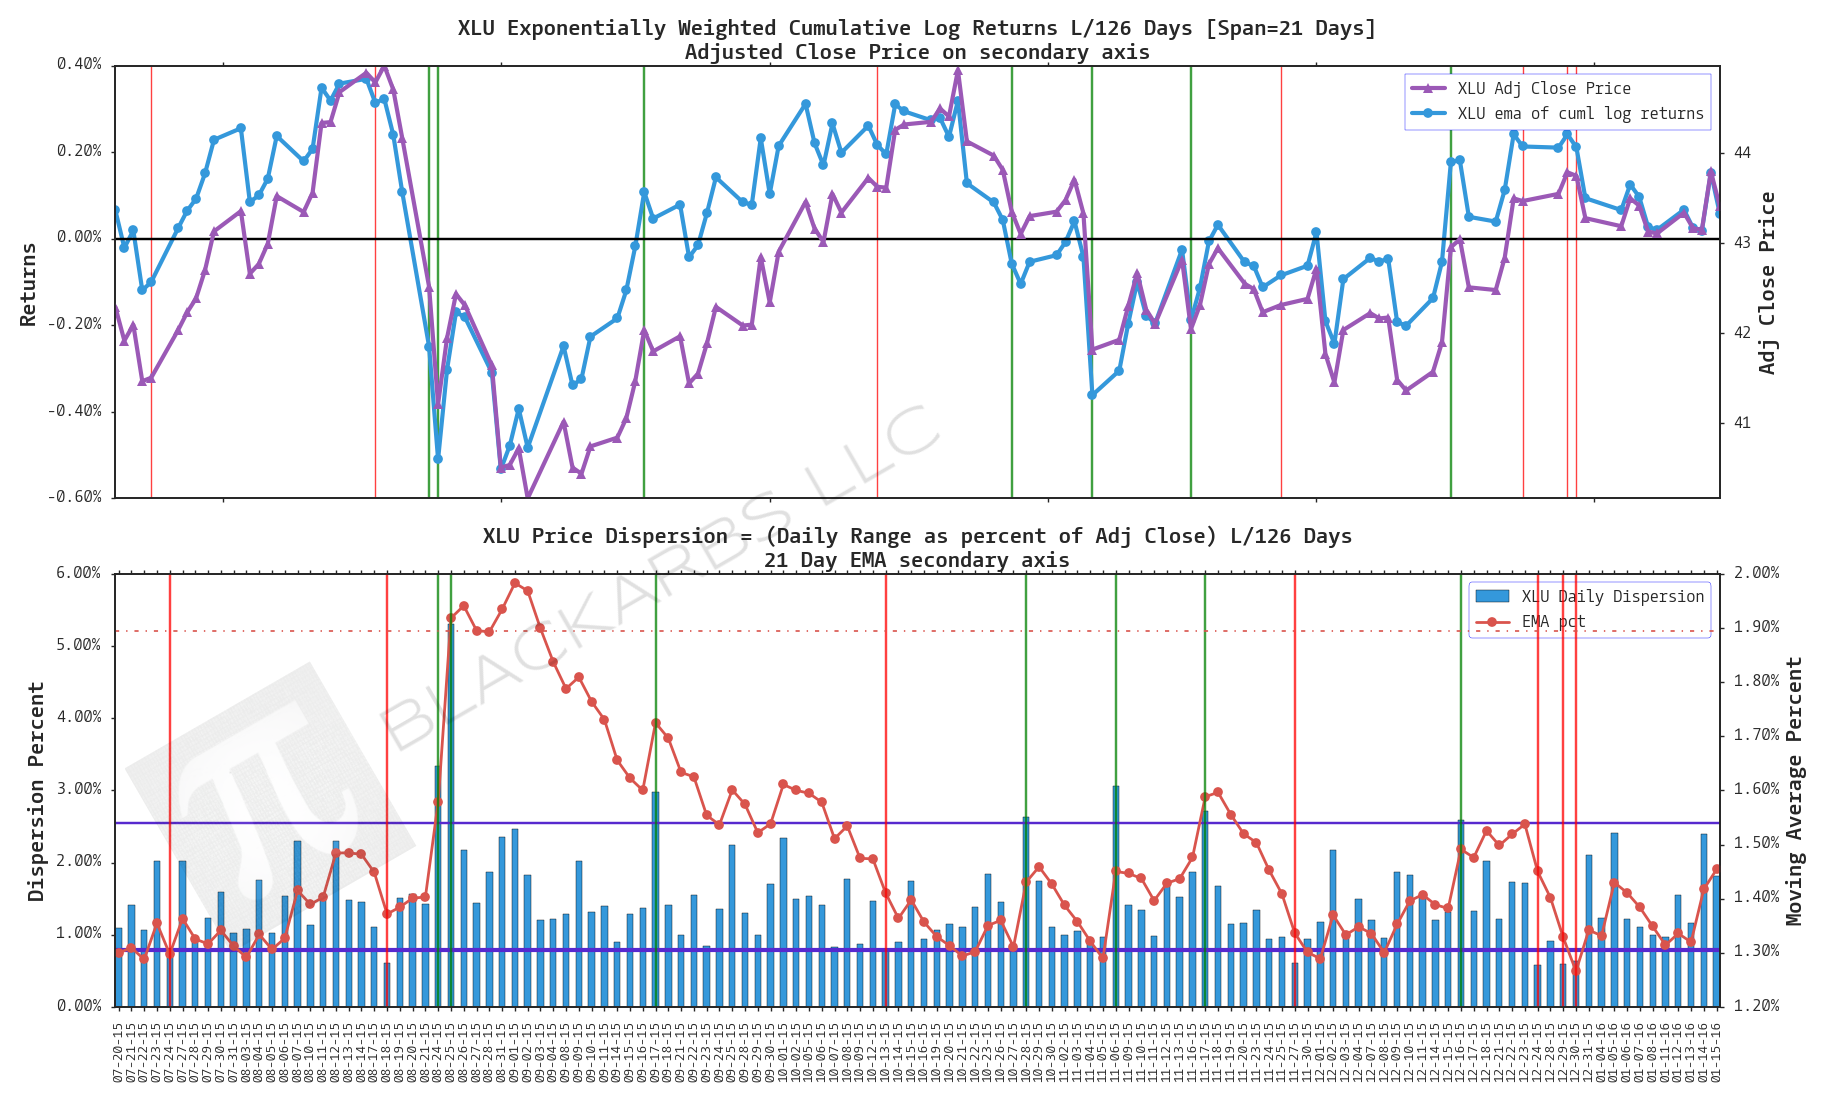
Longs: VWO, KRE, XLU, EEM, HEDJ

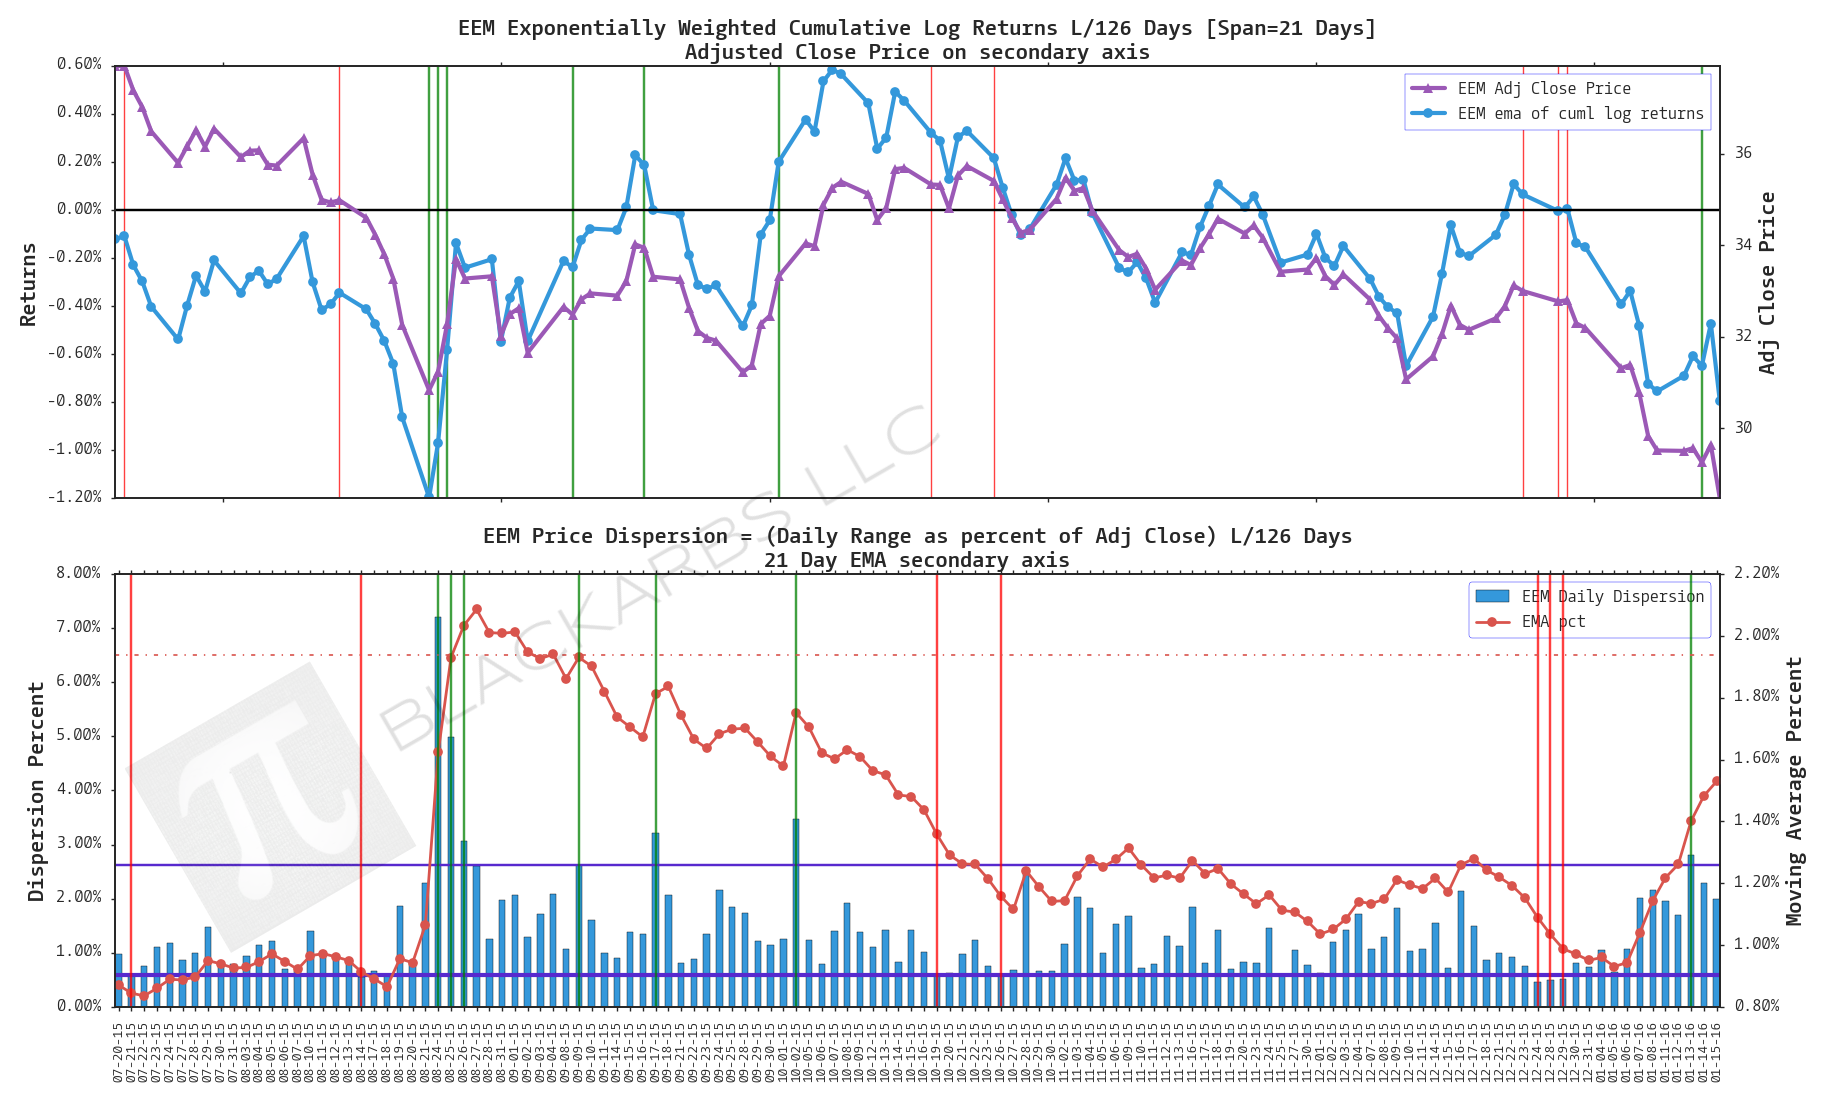
Shorts: EWW, HACK, JNK, XLP, IYR

ETF SKEW LONGS

VWO

KRE

XLU

EEM

HEDJ

ETF SKEW SHORTS

EWW

HACK

JNK

XLP

IYR

COMPOSITE MACRO ETF WEEKLY IMPLIED COST-OF-CAPITAL ESTIMATES VS. CUMULATIVE RETURNS (1/16/16)

WHAT IS THE "IMPLIED COST OF CAPITAL (ICC)" MODEL?

“In accounting and finance the implied cost of equity capital (ICC)—defined as the internal rate of return that equates the current stock price to discounted expected future dividends—is an increasingly popular class of proxies for the expected rate of equity returns. ”

— CHARLES C. Y. WANG; an assistant professor of business administration in the Accounting and Management Unit at Harvard Business School

The basic concept of the ICC model is that it is a forward looking estimate of the implied earnings growth rate of stock given the current stock price. It is calculated using a combination of equity book value and earnings forecasts.

To see a more involved explanation of the previous model I used see here.  

In the past I used a Multi-Stage Residual Income Model. However, this time around I've decided to use a simpler Single-Stage Residual Income Model for these estimates. I chose this because I believe the additional complexity is not warranted given my purpose which I will elaborate on further.

The Single-Stage Residual Income Model as defined by the CFA Institute is the following:

source: CFA Institute

'V' is the stock price at time 0, 'B' is the book value of equity at time 0, 'ROE' is return on equity, 'g' is an assumed long term growth rate and 'r' is the cost of equity/capital. The ICC model essentially solves for 'r' given the other inputs. 

WHY USE THE IMPLIED COST OF CAPITAL MODEL?

There is ongoing debate regarding the ICC model's application and accuracy as a proxy for expected returns as quoted by Charles C. Y. Wang. As an investor/trader I'm less interested in the academic debate and more intrigued by the intuition behind the model and its practical application as a relative value tool. 

I use the ICC model as a relative value measure to identify analyst/institutional expectations and sentiment between different market sectors at a point in time. 

For this purpose I believe it provides great insight. 

COMPOSITE ETF COMPONENTS FOR ICC ESTIMATES

Z-SCORE ICC ESTIMATES AND CUMULATIVE RETURNS COMPARISON CHART

The below plot gives visual representation of the ICC estimates. I z-scored both year-to-date cumulative returns and the ICC estimates so we can view them on the same scale. Examining this chart allows investors to quickly determine which market sectors are outperforming (underperforming) their respective Implied Cost of Capital Estimates. 

The extreme cases show where there are disconnects between the analyst community's forward earnings expectations and actual market performance. The plot is sorted left to right by ascending ICC estimates.

LAST 252 TRADING DAYS 

Data Sources: YCharts.com, Yahoo Finance

Data Sources: YCharts.com, Yahoo Finance

LAST 126 TRADING DAYS

Data Sources: YCharts.com, Yahoo Finance

Data Sources: YCharts.com, Yahoo Finance

LAST 63 TRADING DAYS

Data Sources: YCharts.com, Yahoo Finance

Data Sources: YCharts.com, Yahoo Finance

LAST 21 TRADING DAYS

Data Sources: YCharts.com, Yahoo Finance

Data Sources: YCharts.com, Yahoo Finance

LAST 10 TRADING DAYS

Data Sources: YCharts.com, Yahoo Finance

Data Sources: YCharts.com, Yahoo Finance

CATEGORY AVERAGE ICC ESTIMATES

Long term growth rate (g) is assumed to be 2.5% reflective of our low growth high debt economic environment. 

ALL ETF ICC ESTIMATES BY CATEGORY

COMPOSITE MACRO ETF WEEKLY ANALYTICS (1/16/2016)

LAYOUT (Organized by Time Period): 

  1. Composite ETF Cumulative Returns Momentum Bar plot

  2. Composite ETF Cumulative Returns Line plot

  3. Composite ETF Risk-Adjusted Returns Scatter plot (Std vs Mean)

  4. Composite ETF Risk-Adjusted Return Correlations Heatmap (Clusterplot)

  5. Composite ETF Cumulative Return Tables

  6. Notable Trends and Observations

COMPOSITE ETF COMPONENTS:

LAST 252 TRADING DAYS

LAST 126 TRADING DAYS

LAST 63 TRADING DAYS

LAST 21 TRADING DAYS

LAST 10 TRADING DAYS

Cumulative Return Tables:

Notable Observations and Trends:

  • Investors have been extremely defensive in recent trading as evidenced by Utilities, Bonds, and Precious Metals making the top 3 performers over the last 21, and 10 day periods. 
  • Only one composite has had positive cumulative returns over the last 252 days - Treasury Yields. If you're a long investor there have been very few ways to escape the selling outside of moving to cash.
  • Flexible investors and traders are making a killing to the short side as selling has been very broad based across sectors.
  • We are in a binary risk-on, risk-off phase of investing as evidenced by the increased correlations across sectors and the very high negative correlations of traditional safe havens/crash investments. (Bonds, Precious Metals + Precious Metals Miners)

USING IMPLIED VOLATILITY TO PREDICT EQUITY/ETF RETURNS (1/11/16)

To see the origin of this series click here

In the paper that inspired this series ("What Does Individual Option Volatility Smirk Tell Us About Future Equity Returns?") the authors research shows that Option Volatility Smirk they calculate is predictive up to 4 weeks. Therefore, each week, I will calculate the Long/Short legs of a portfolio constructed by following their criteria as closely as possible. I will then track the results of the Long/Short portfolio, in equity returns, cumulatively for 4 weeks before rotating out of that portfolio. The ETF's are selected from the following groups:


With that said, it is now time to update Portfolio One's, one week results. 

PORTFOLIO ONE

Longs: XLF, EPI, VOX, XLI, XLP, XLV, HEDJ, IYT

Shorts: EZU, XLB, GDXJ, XRT, XHB, VGK, KRE, EWT

One Week Results: 

PORTFOLIO TWO

Longs: FEZ, VPU, INDA, IWB, HEDJ, IJR, IYT

Shorts: EEM, VDE, IAU, EWH, LQD, EWW, EWT

ETF SKEW LONGS

FEZ

VPU

INDA

IWB

HEDJ

IJR

IYT

ETF SKEW SHORTS

EEM

VDE

IAU

EWH

LQD

EWW

EWT

COMPOSITE MACRO ETF WEEKLY IMPLIED COST-OF-CAPITAL ESTIMATES VS. CUMULATIVE RETURNS (1/09/16)

WHAT IS THE "IMPLIED COST OF CAPITAL (ICC)" MODEL?

“In accounting and finance the implied cost of equity capital (ICC)—defined as the internal rate of return that equates the current stock price to discounted expected future dividends—is an increasingly popular class of proxies for the expected rate of equity returns. ”

— CHARLES C. Y. WANG; an assistant professor of business administration in the Accounting and Management Unit at Harvard Business School

The basic concept of the ICC model is that it is a forward looking estimate of the implied earnings growth rate of stock given the current stock price. It is calculated using a combination of equity book value and earnings forecasts.

To see a more involved explanation of the previous model I used see here.  

In the past I used a Multi-Stage Residual Income Model. However, this time around I've decided to use a simpler Single-Stage Residual Income Model for these estimates. I chose this because I believe the additional complexity is not warranted given my purpose which I will elaborate on further.

The Single-Stage Residual Income Model as defined by the CFA Institute is the following:

source: CFA Institute

'V' is the stock price at time 0, 'B' is the book value of equity at time 0, 'ROE' is return on equity, 'g' is an assumed long term growth rate and 'r' is the cost of equity/capital. The ICC model essentially solves for 'r' given the other inputs. 

WHY USE THE IMPLIED COST OF CAPITAL MODEL?

There is ongoing debate regarding the ICC model's application and accuracy as a proxy for expected returns as quoted by Charles C. Y. Wang. As an investor/trader I'm less interested in the academic debate and more intrigued by the intuition behind the model and its practical application as a relative value tool. 

I use the ICC model as a relative value measure to identify analyst/institutional expectations and sentiment between different market sectors at a point in time. 

For this purpose I believe it provides great insight. 

COMPOSITE ETF COMPONENTS FOR ICC ESTIMATES

Z-SCORE ICC ESTIMATES AND CUMULATIVE RETURNS COMPARISON CHART

The below plot gives visual representation of the ICC estimates. I z-scored both year-to-date cumulative returns and the ICC estimates so we can view them on the same scale. Examining this chart allows investors to quickly determine which market sectors are outperforming (underperforming) their respective Implied Cost of Capital Estimates. 

The extreme cases show where there are disconnects between the analyst community's forward earnings expectations and actual market performance. The plot is sorted left to right by ascending ICC estimates.

LAST 252 TRADING DAYS 

Data Sources: YCharts.com, Yahoo Finance

Data Sources: YCharts.com, Yahoo Finance

LAST 126 TRADING DAYS

Data Sources: YCharts.com, Yahoo Finance

Data Sources: YCharts.com, Yahoo Finance

LAST 63 TRADING DAYS

Data Sources: YCharts.com, Yahoo Finance

Data Sources: YCharts.com, Yahoo Finance

LAST 21 TRADING DAYS

Data Sources: YCharts.com, Yahoo Finance

Data Sources: YCharts.com, Yahoo Finance

LAST 10 TRADING DAYS

Data Sources: YCharts.com, Yahoo Finance

Data Sources: YCharts.com, Yahoo Finance

CATEGORY AVERAGE ICC ESTIMATES

Long term growth rate (g) is assumed to be 2.5% reflective of our low growth high debt economic environment. 

ALL ETF ICC ESTIMATES BY CATEGORY