

COMPOSITE MACRO ETF WEEKLY ANALYTICS (1/16/2016)
/LAYOUT (Organized by Time Period):
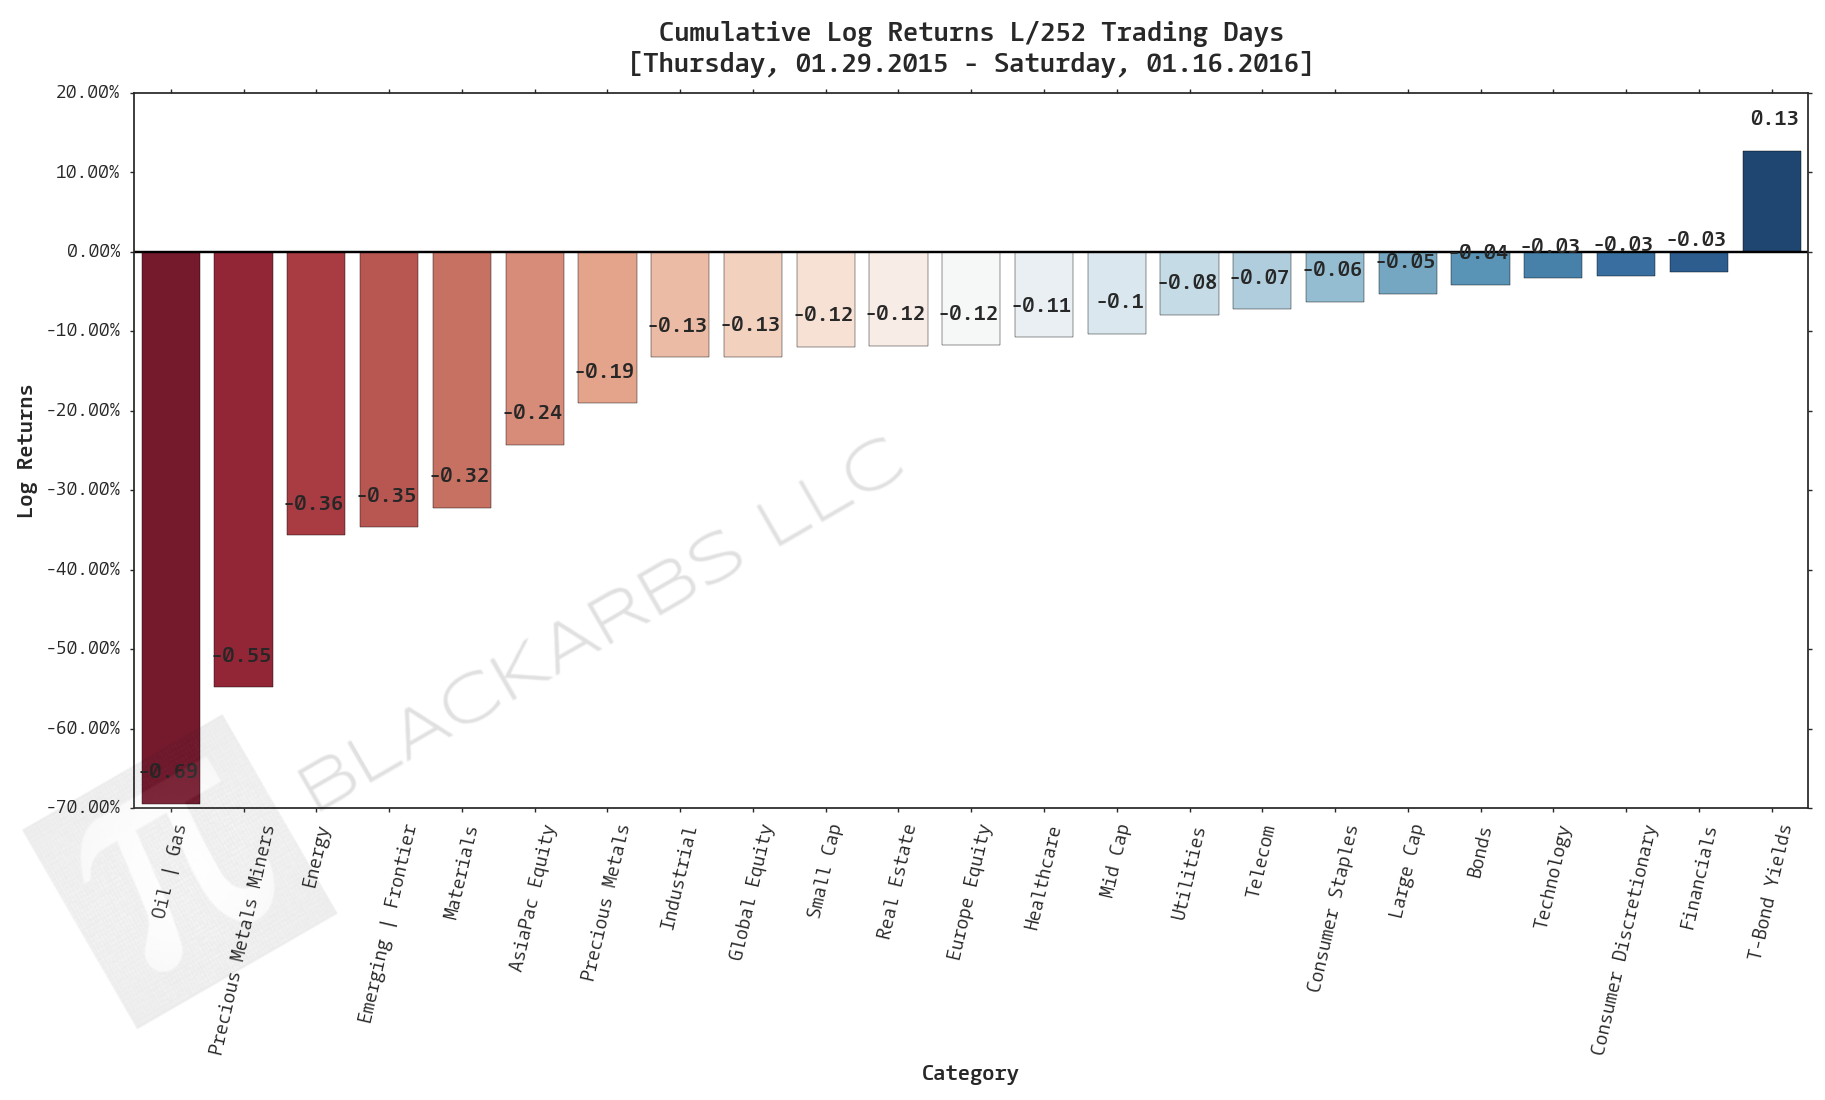
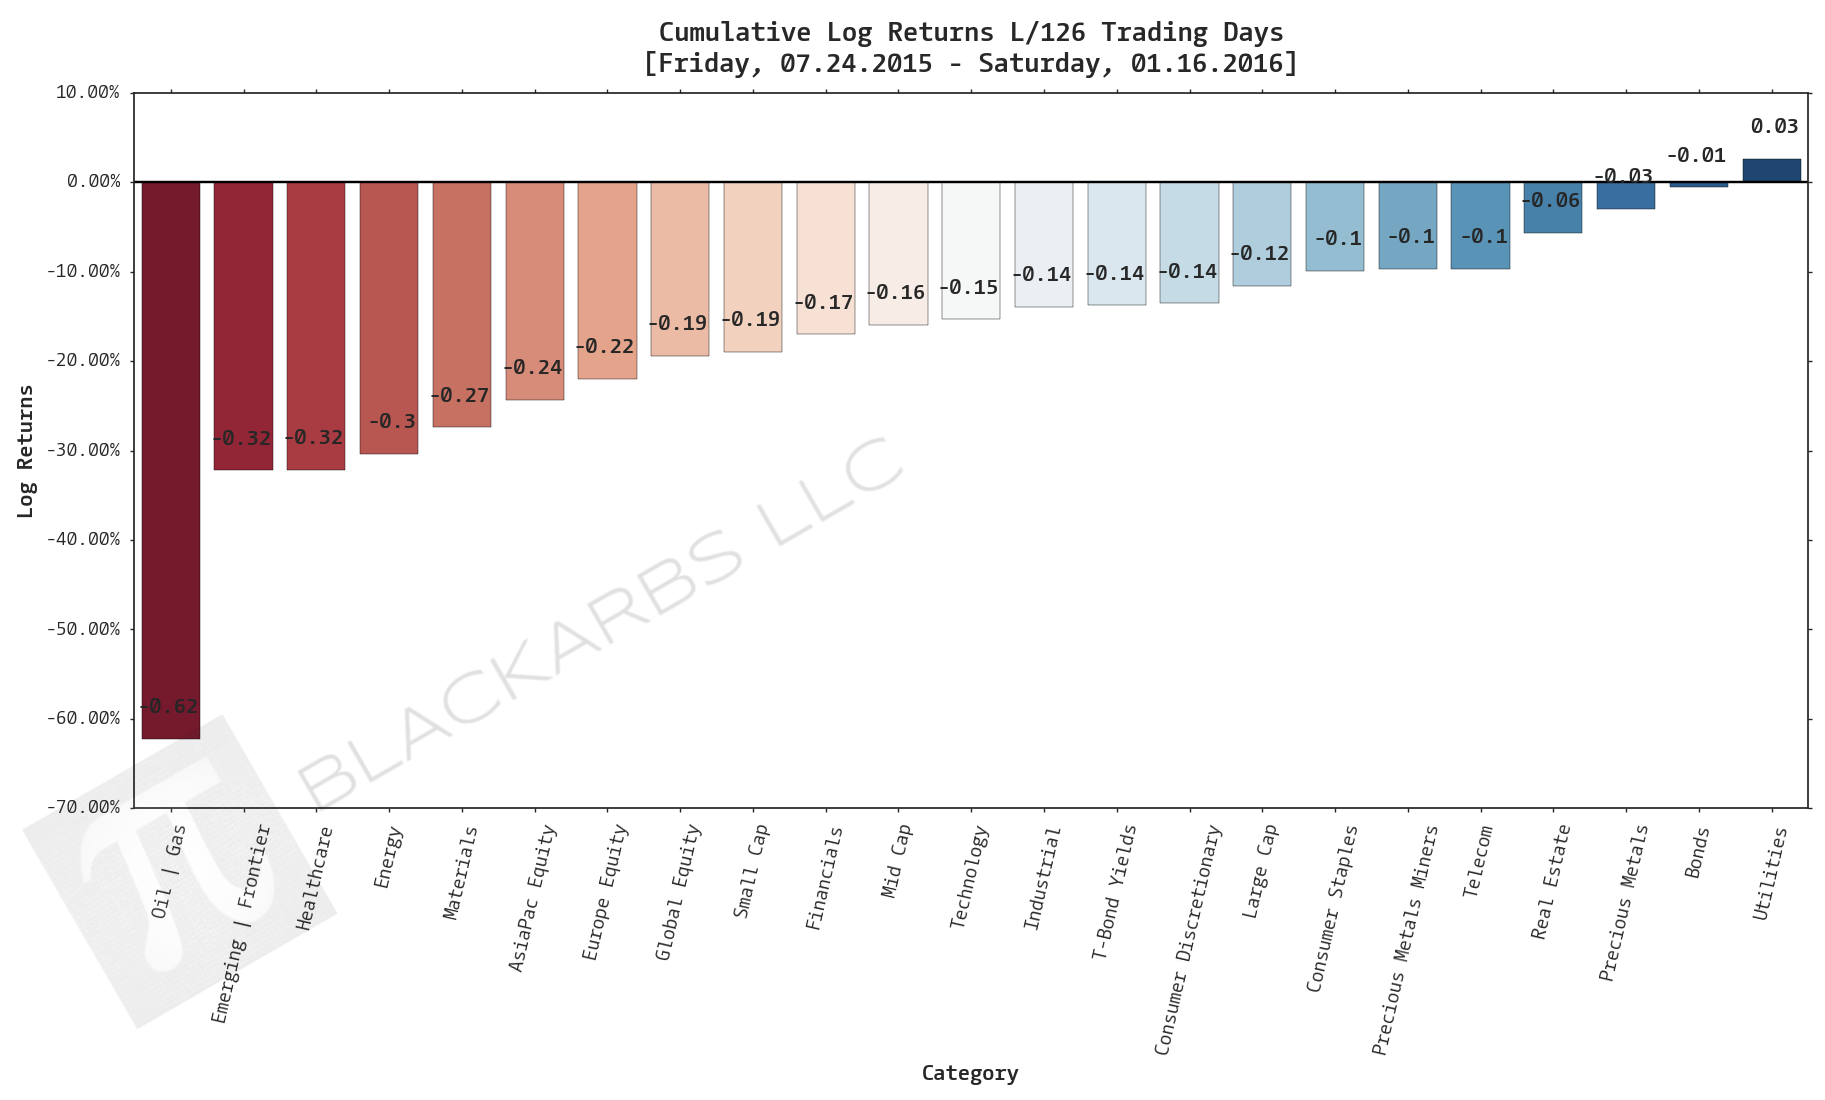
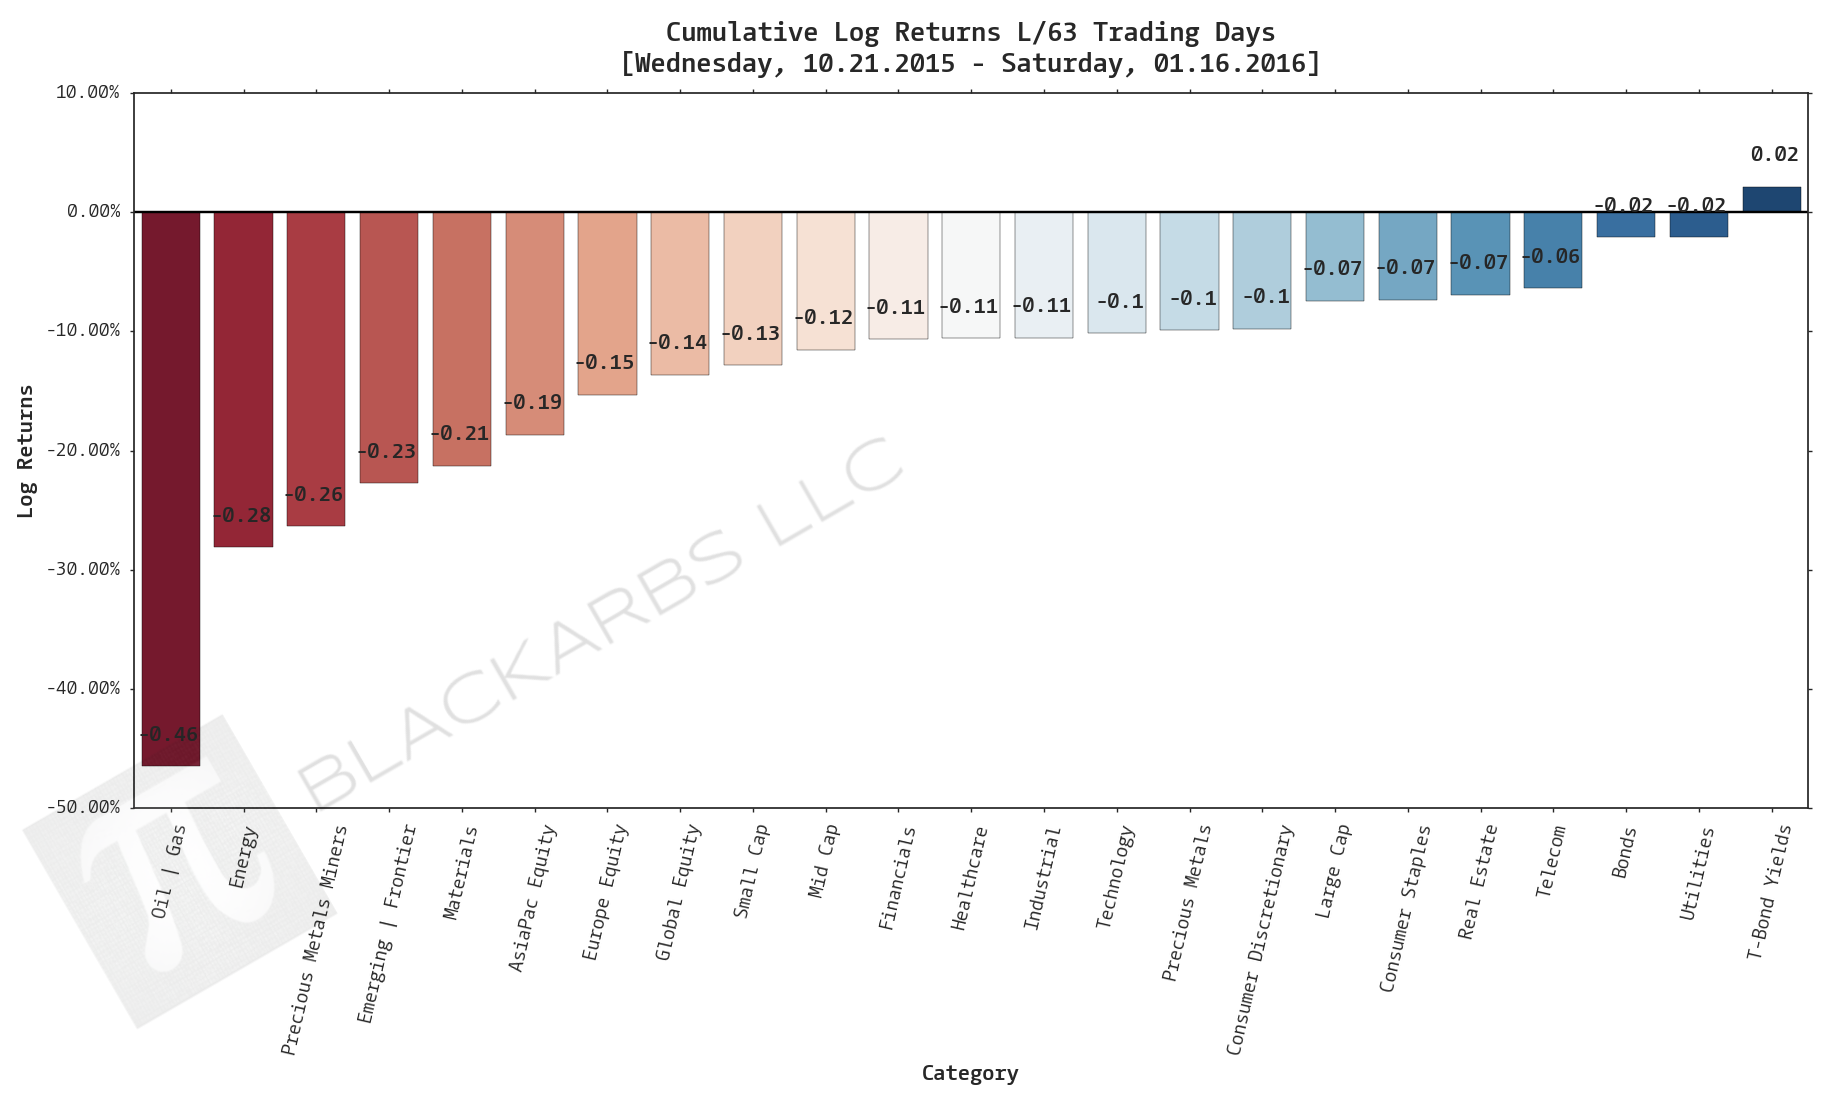
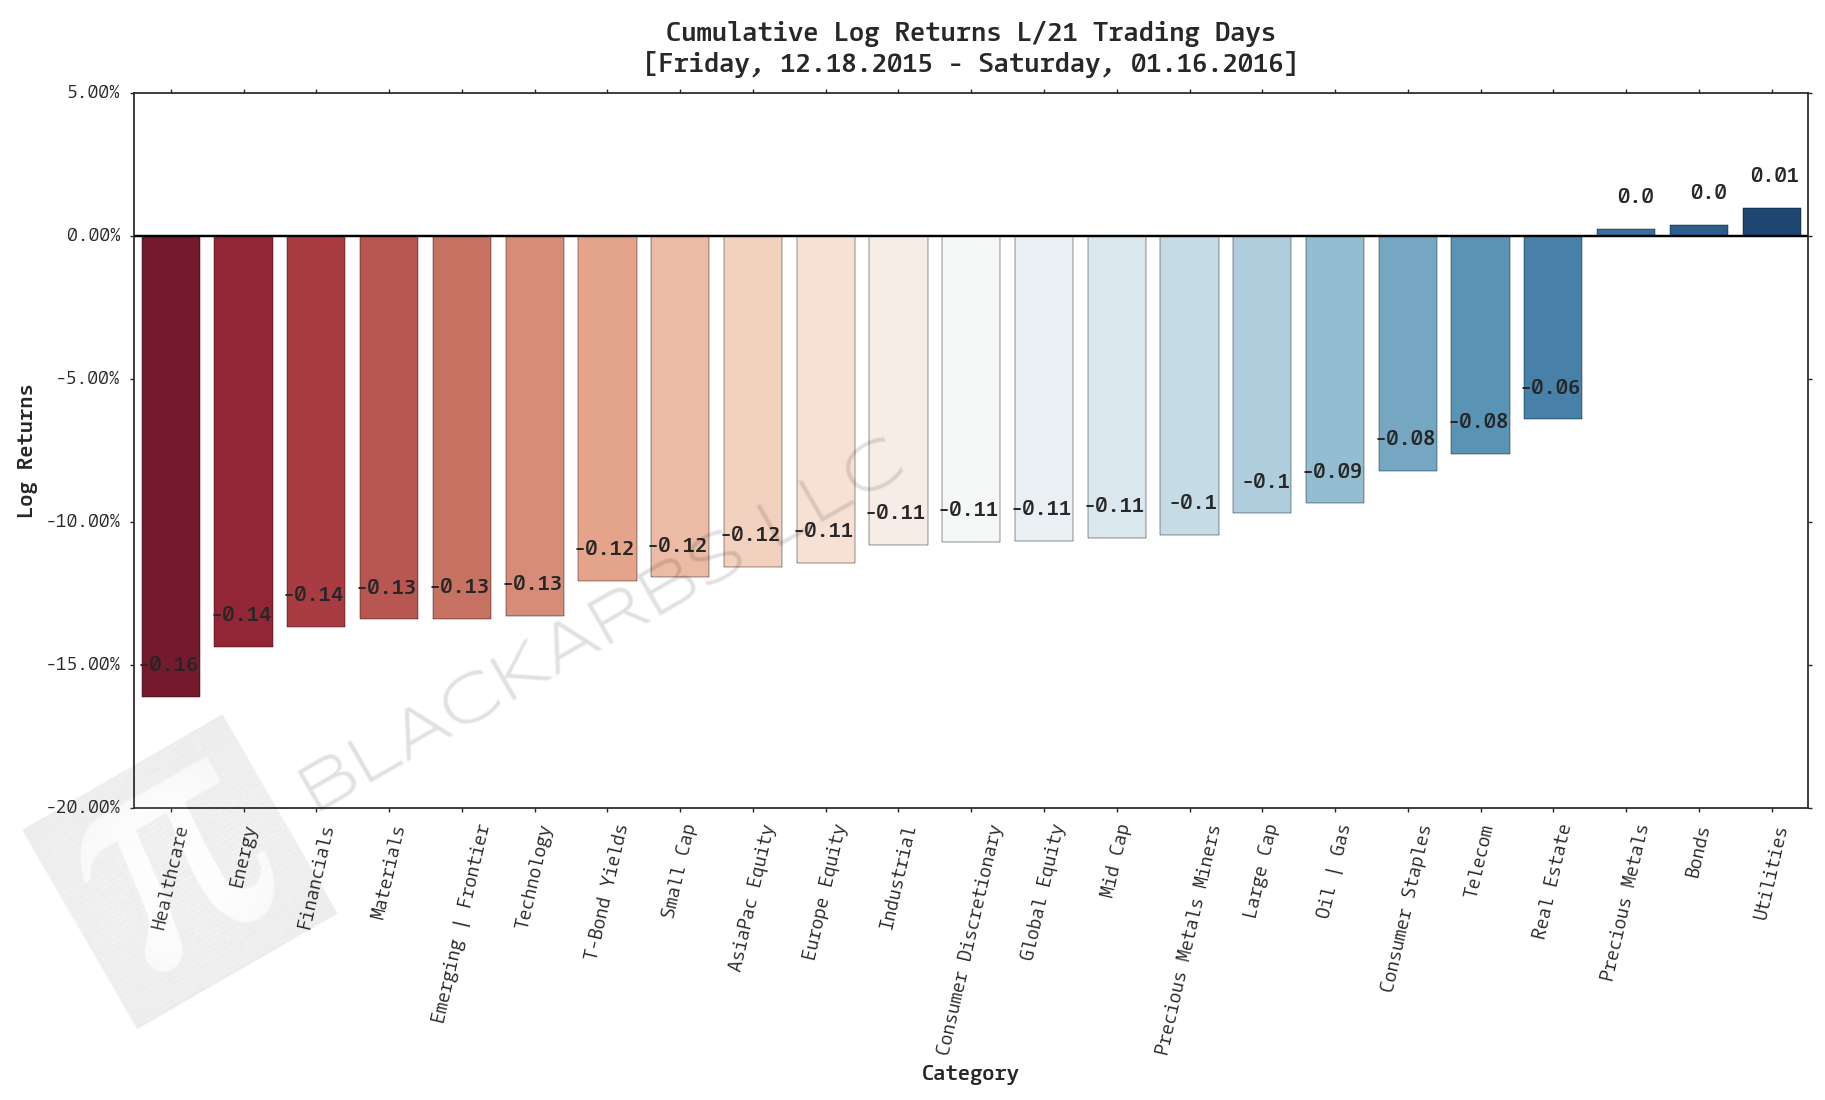
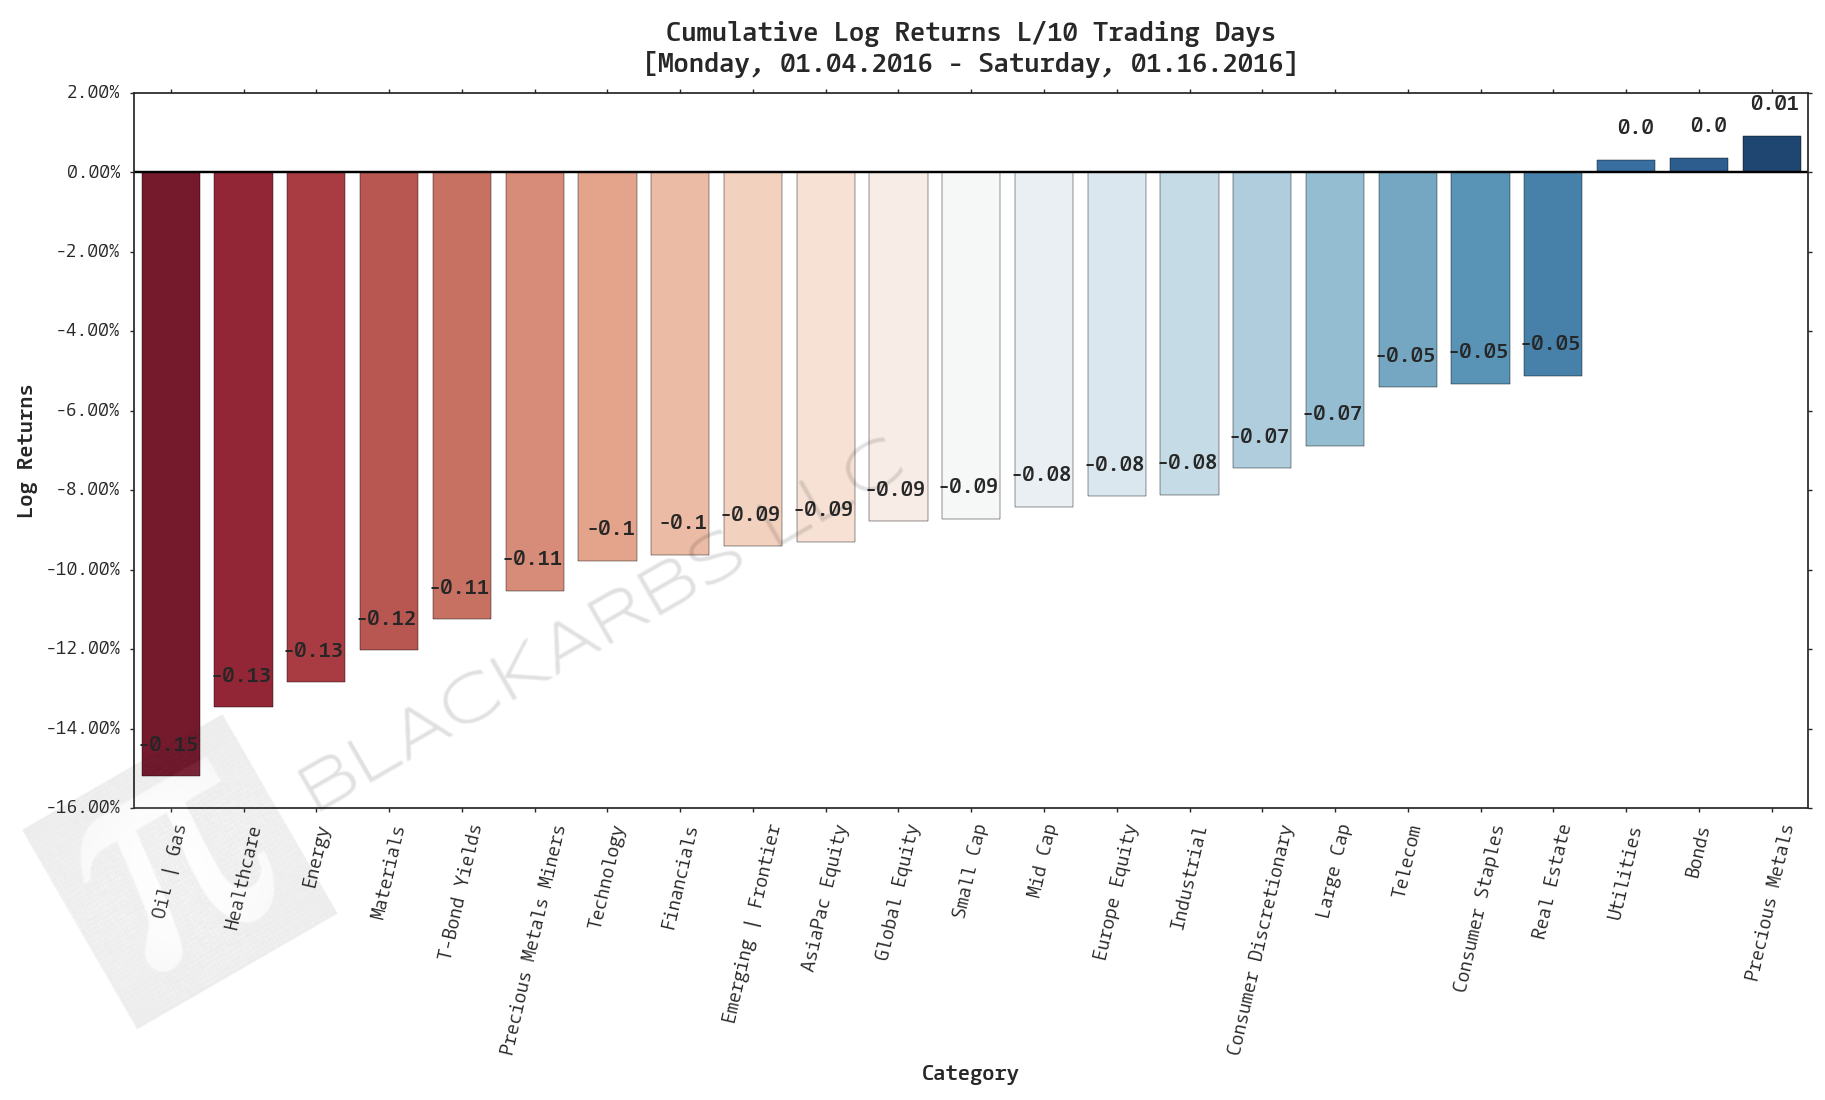
Composite ETF Cumulative Returns Momentum Bar plot
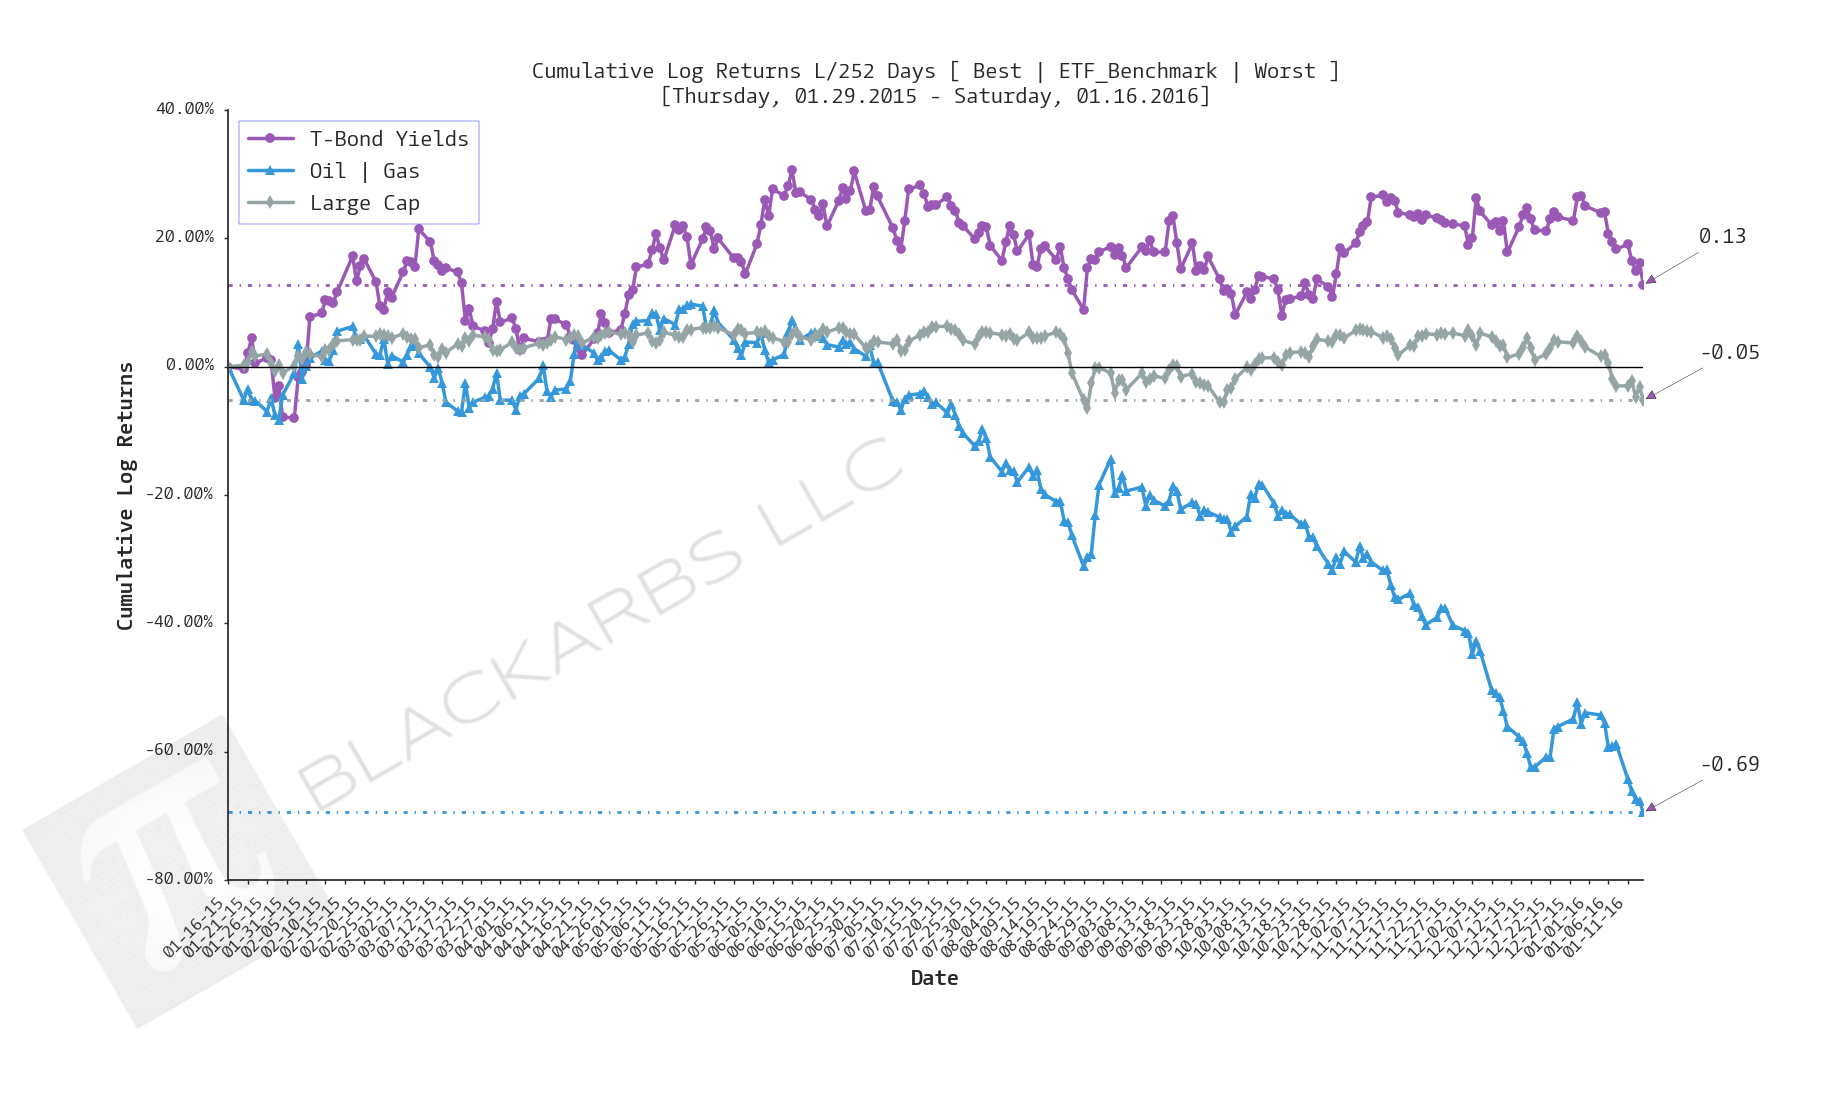
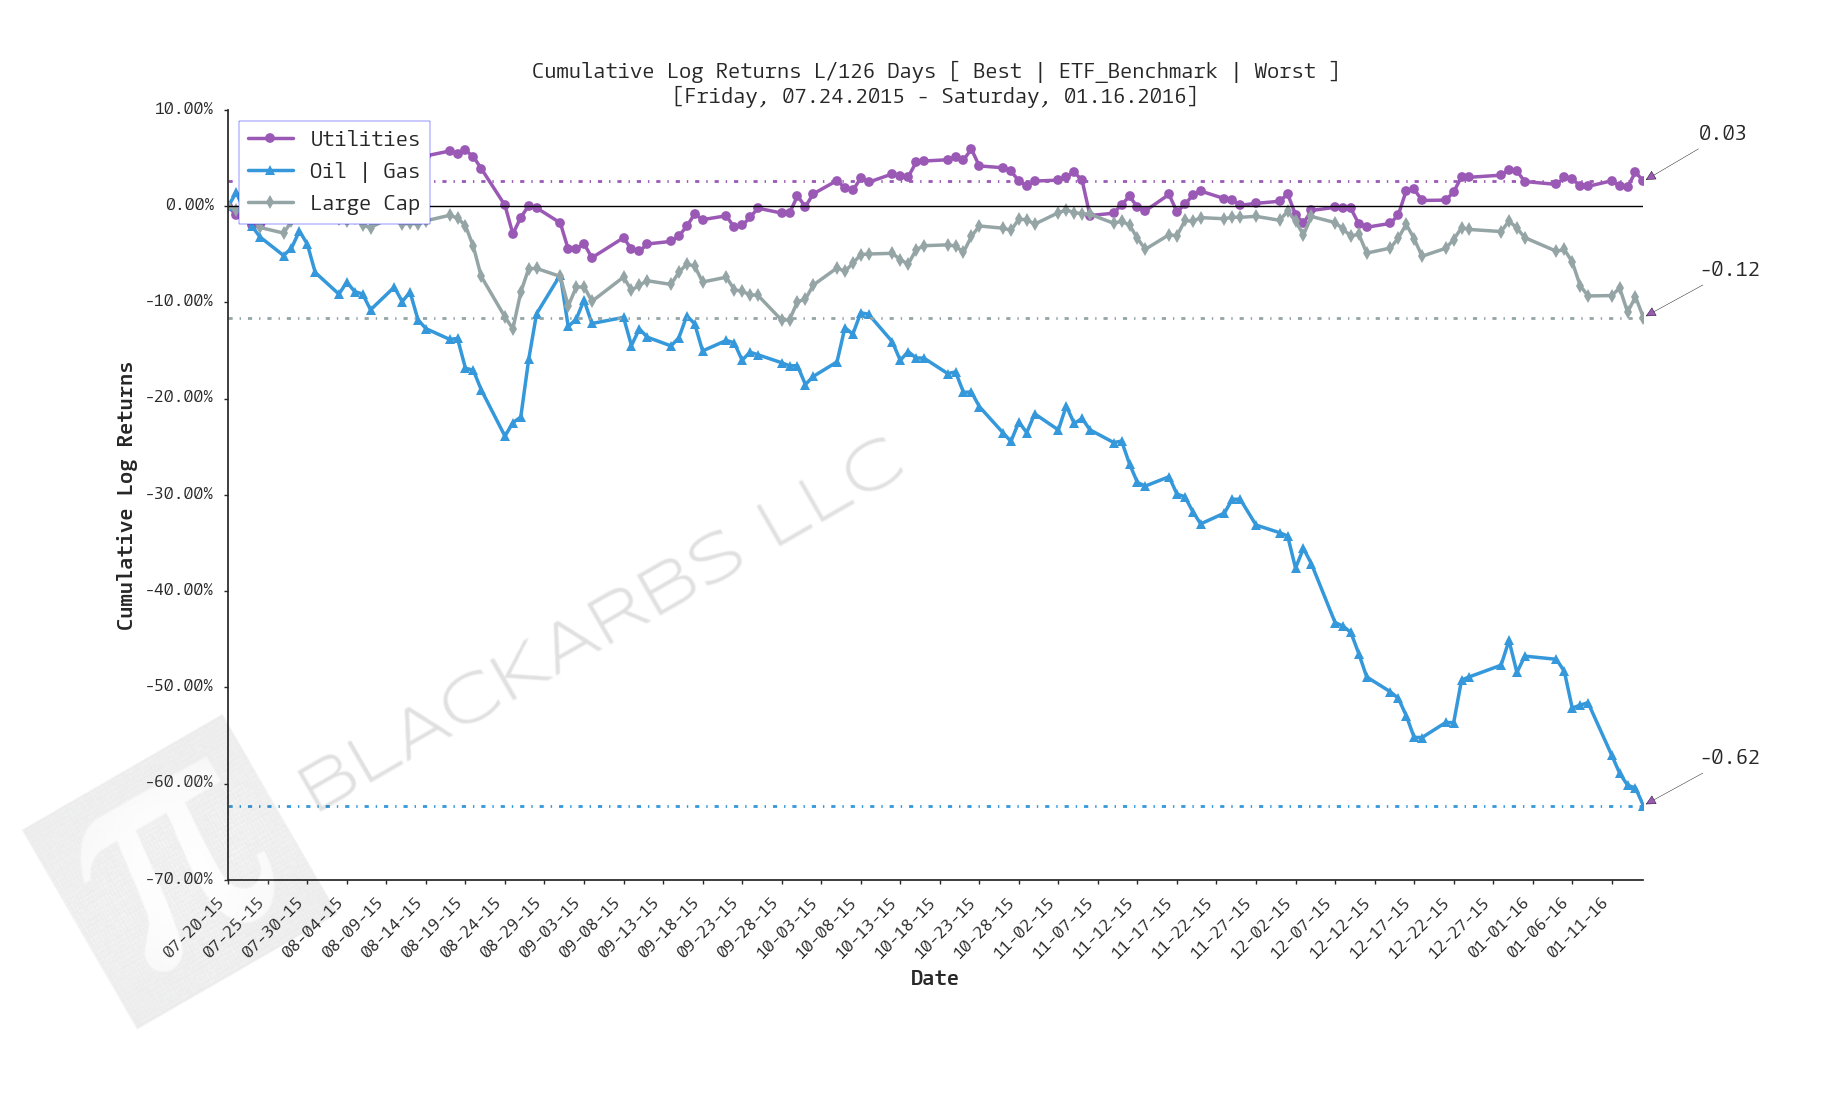
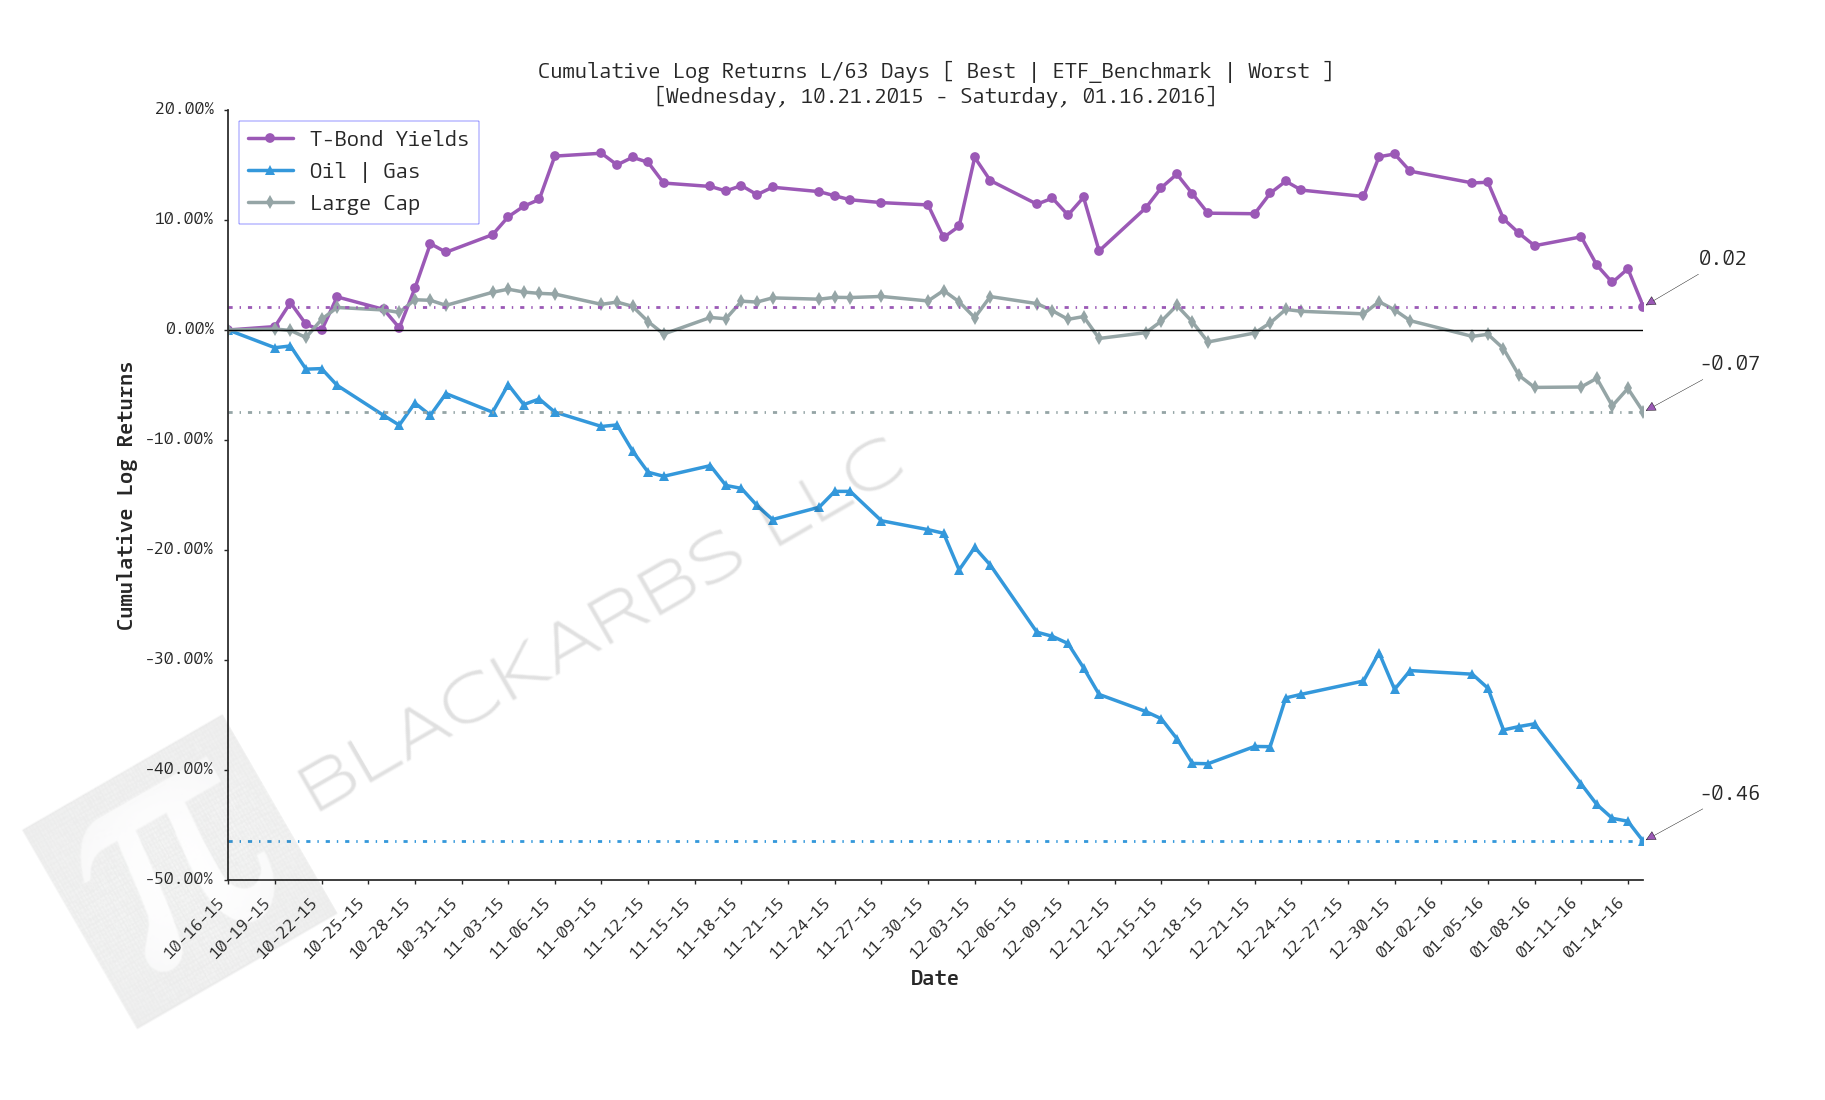
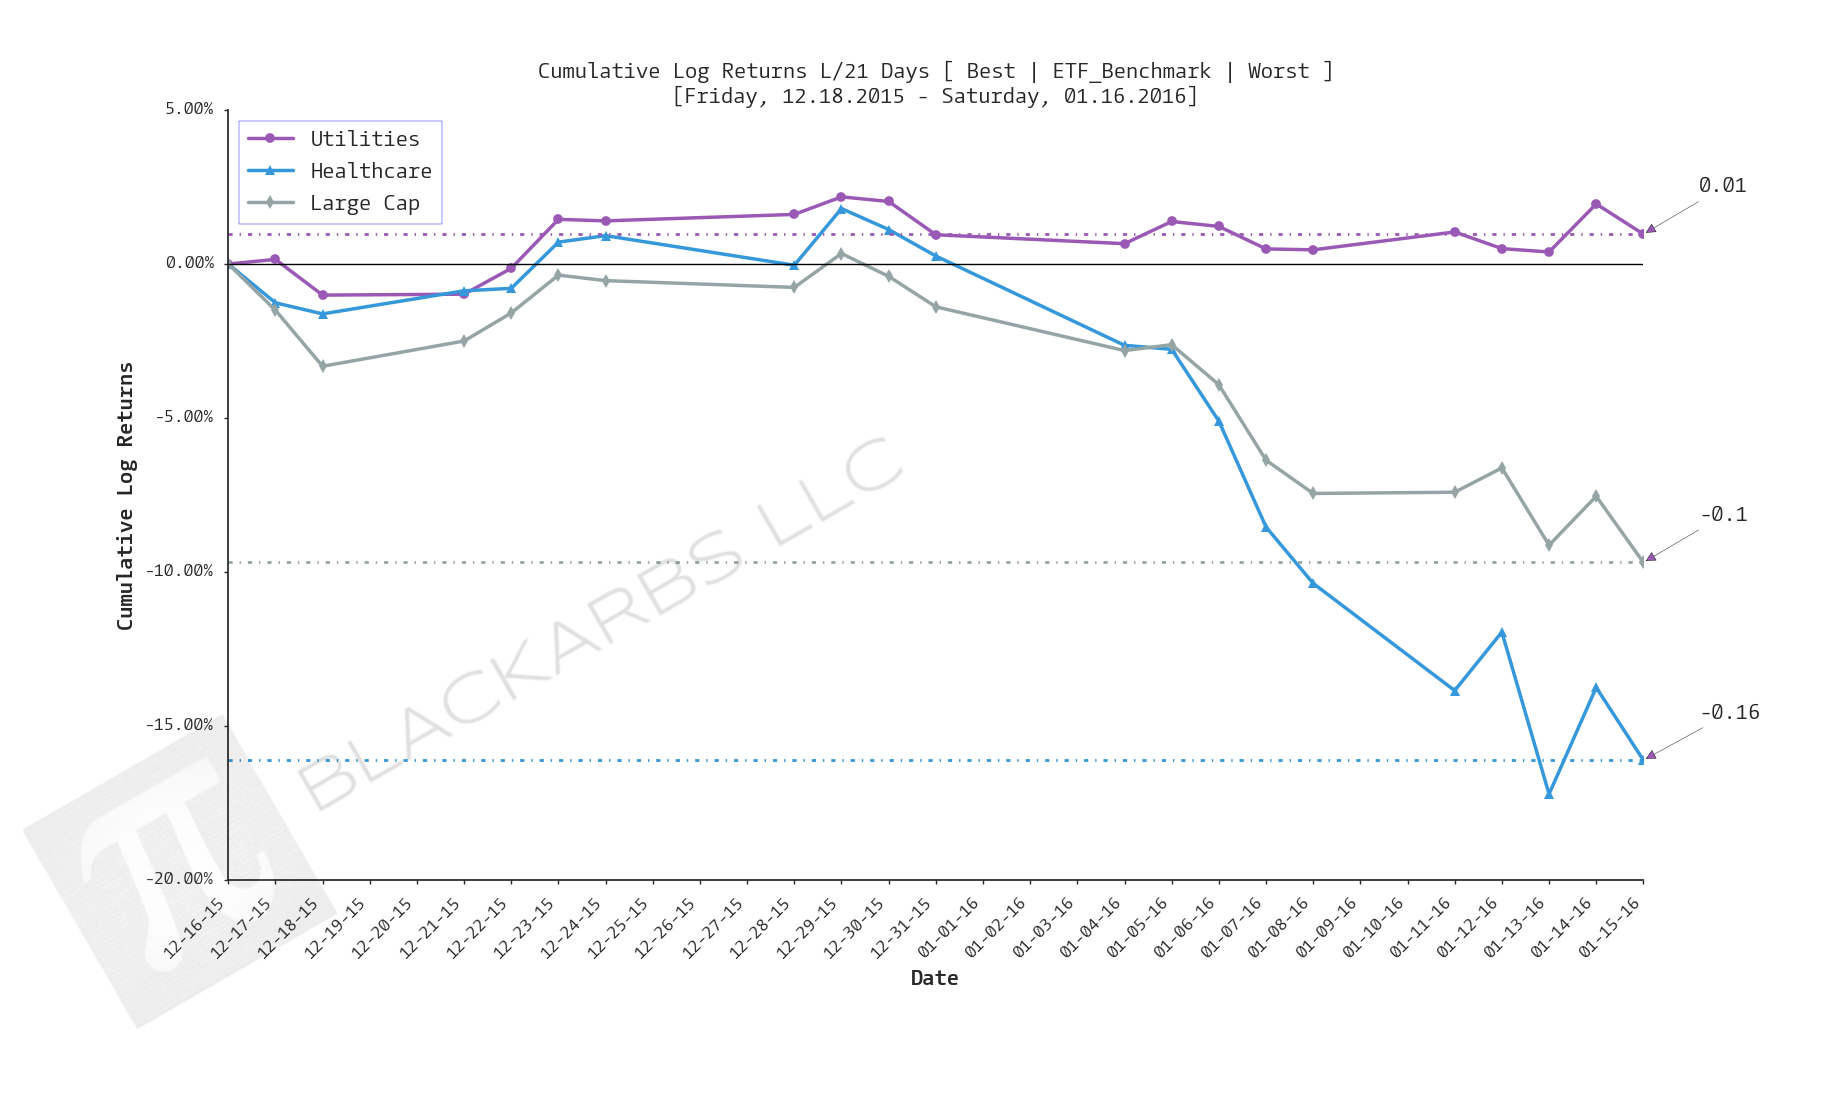
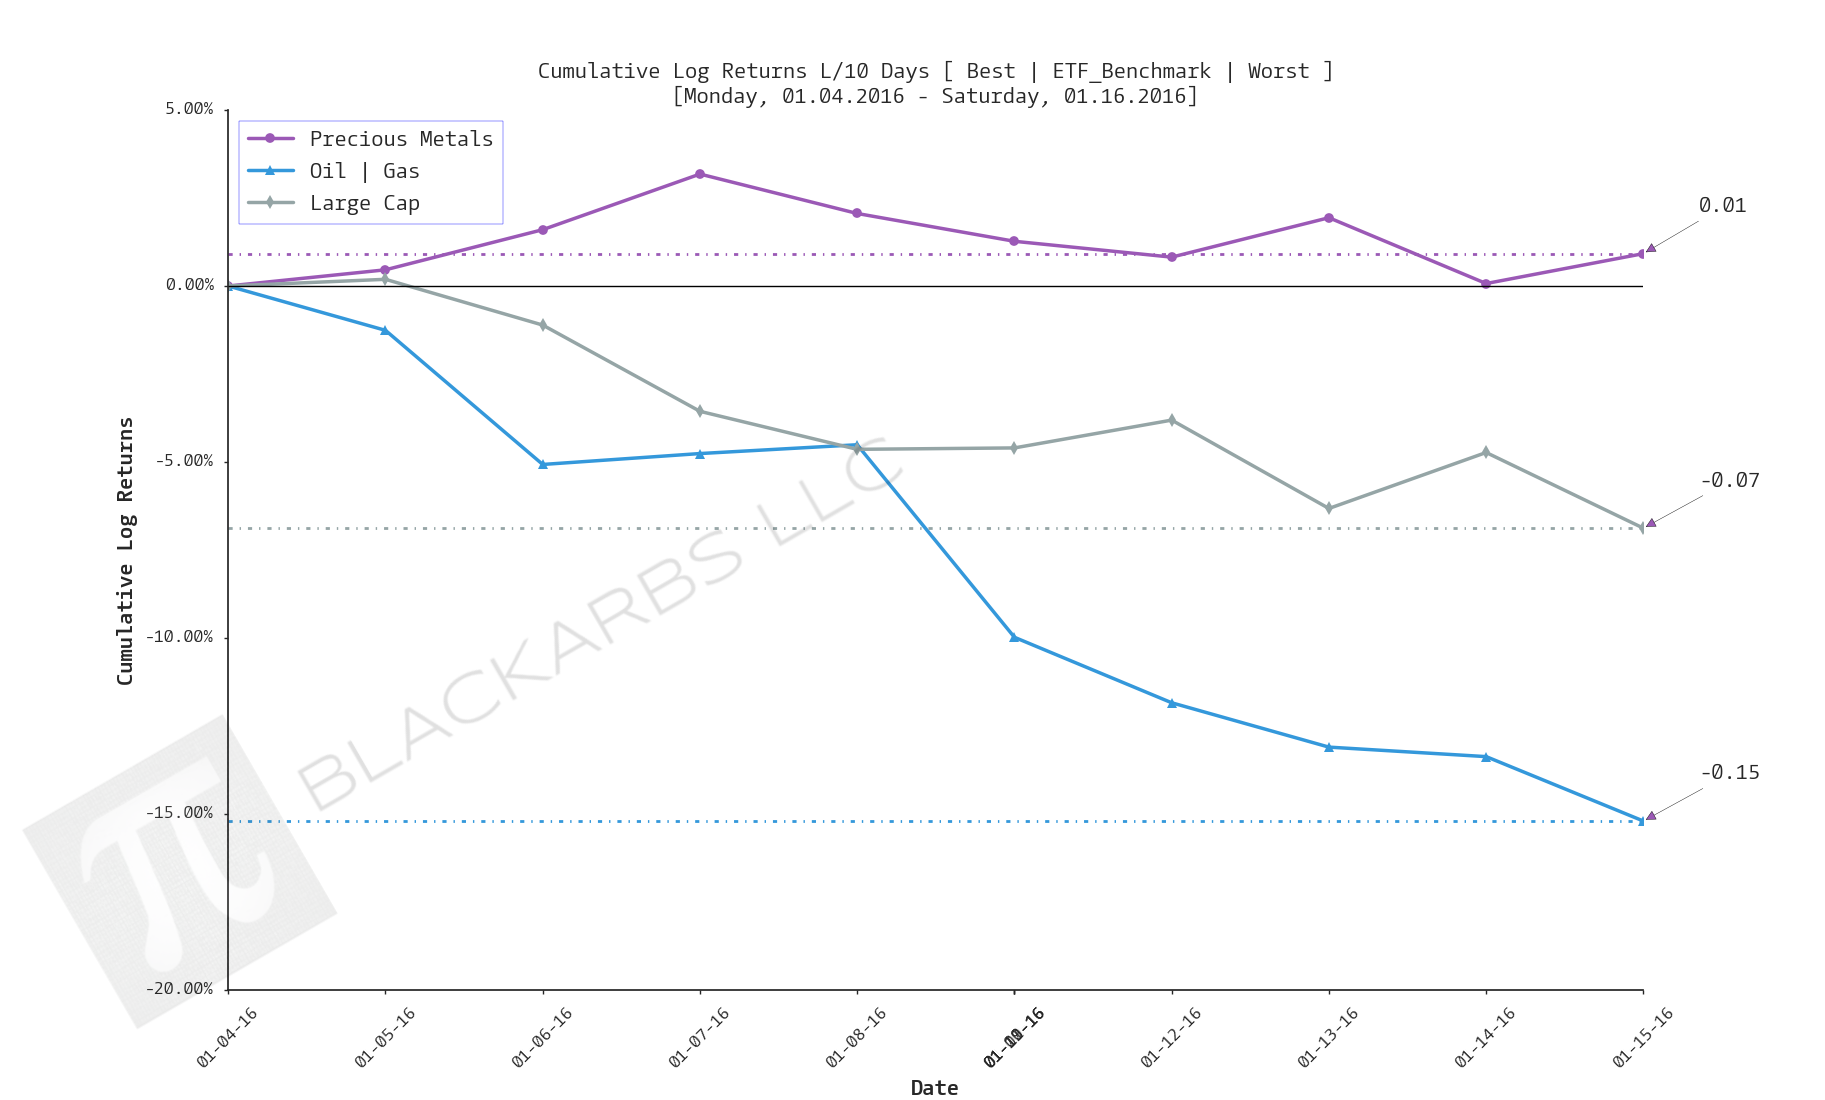
Composite ETF Cumulative Returns Line plot
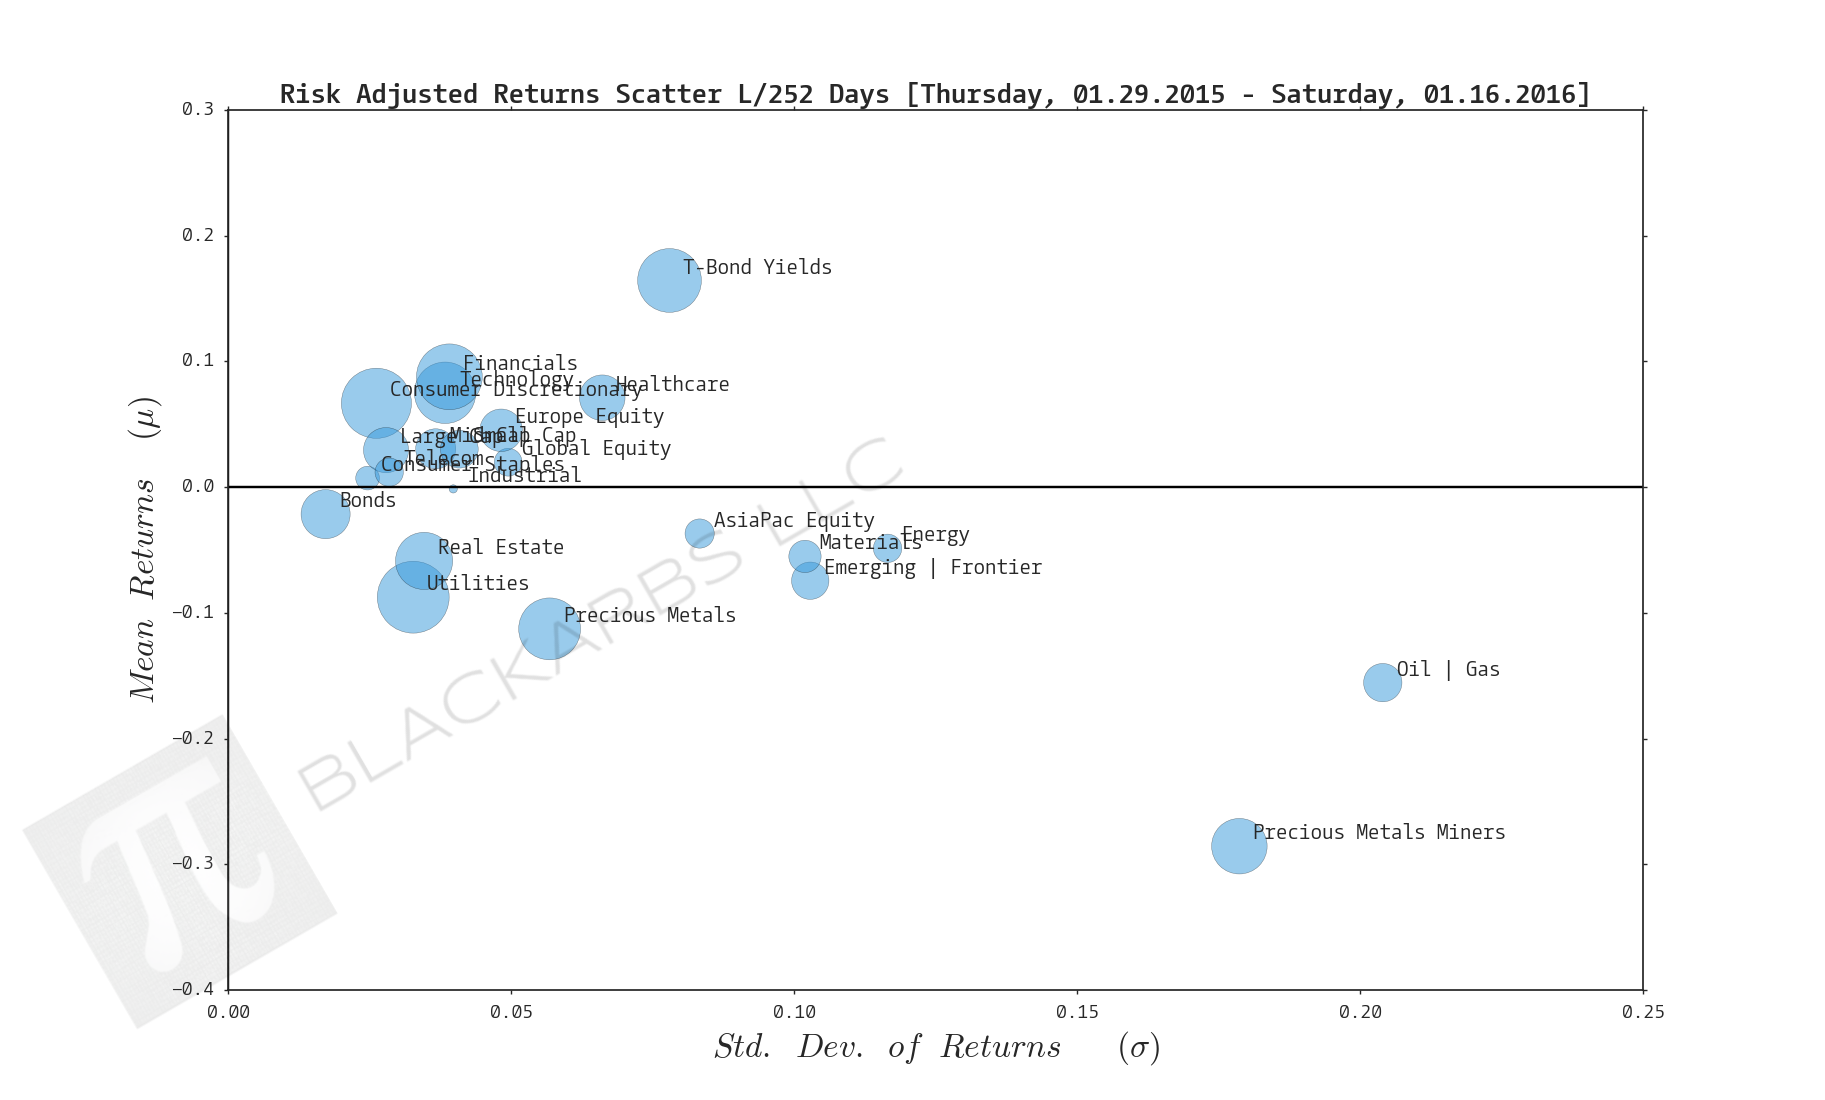
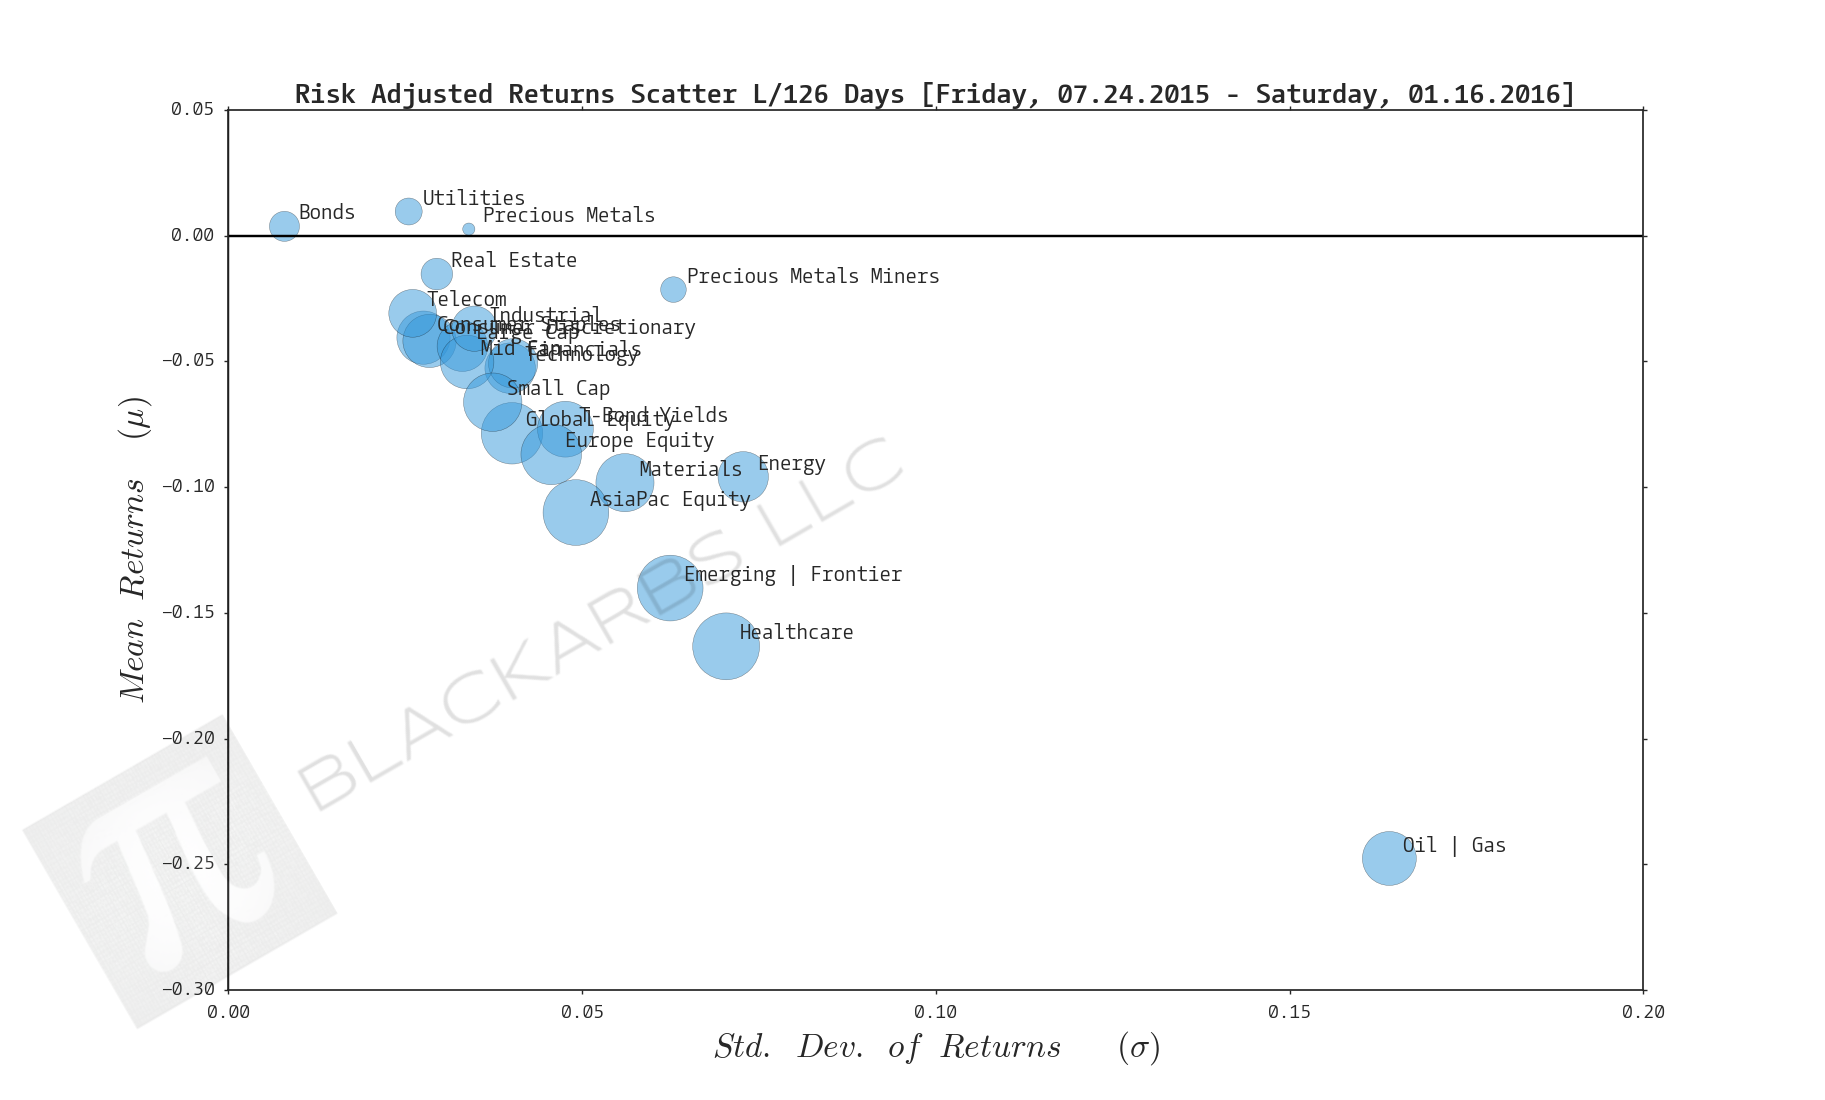
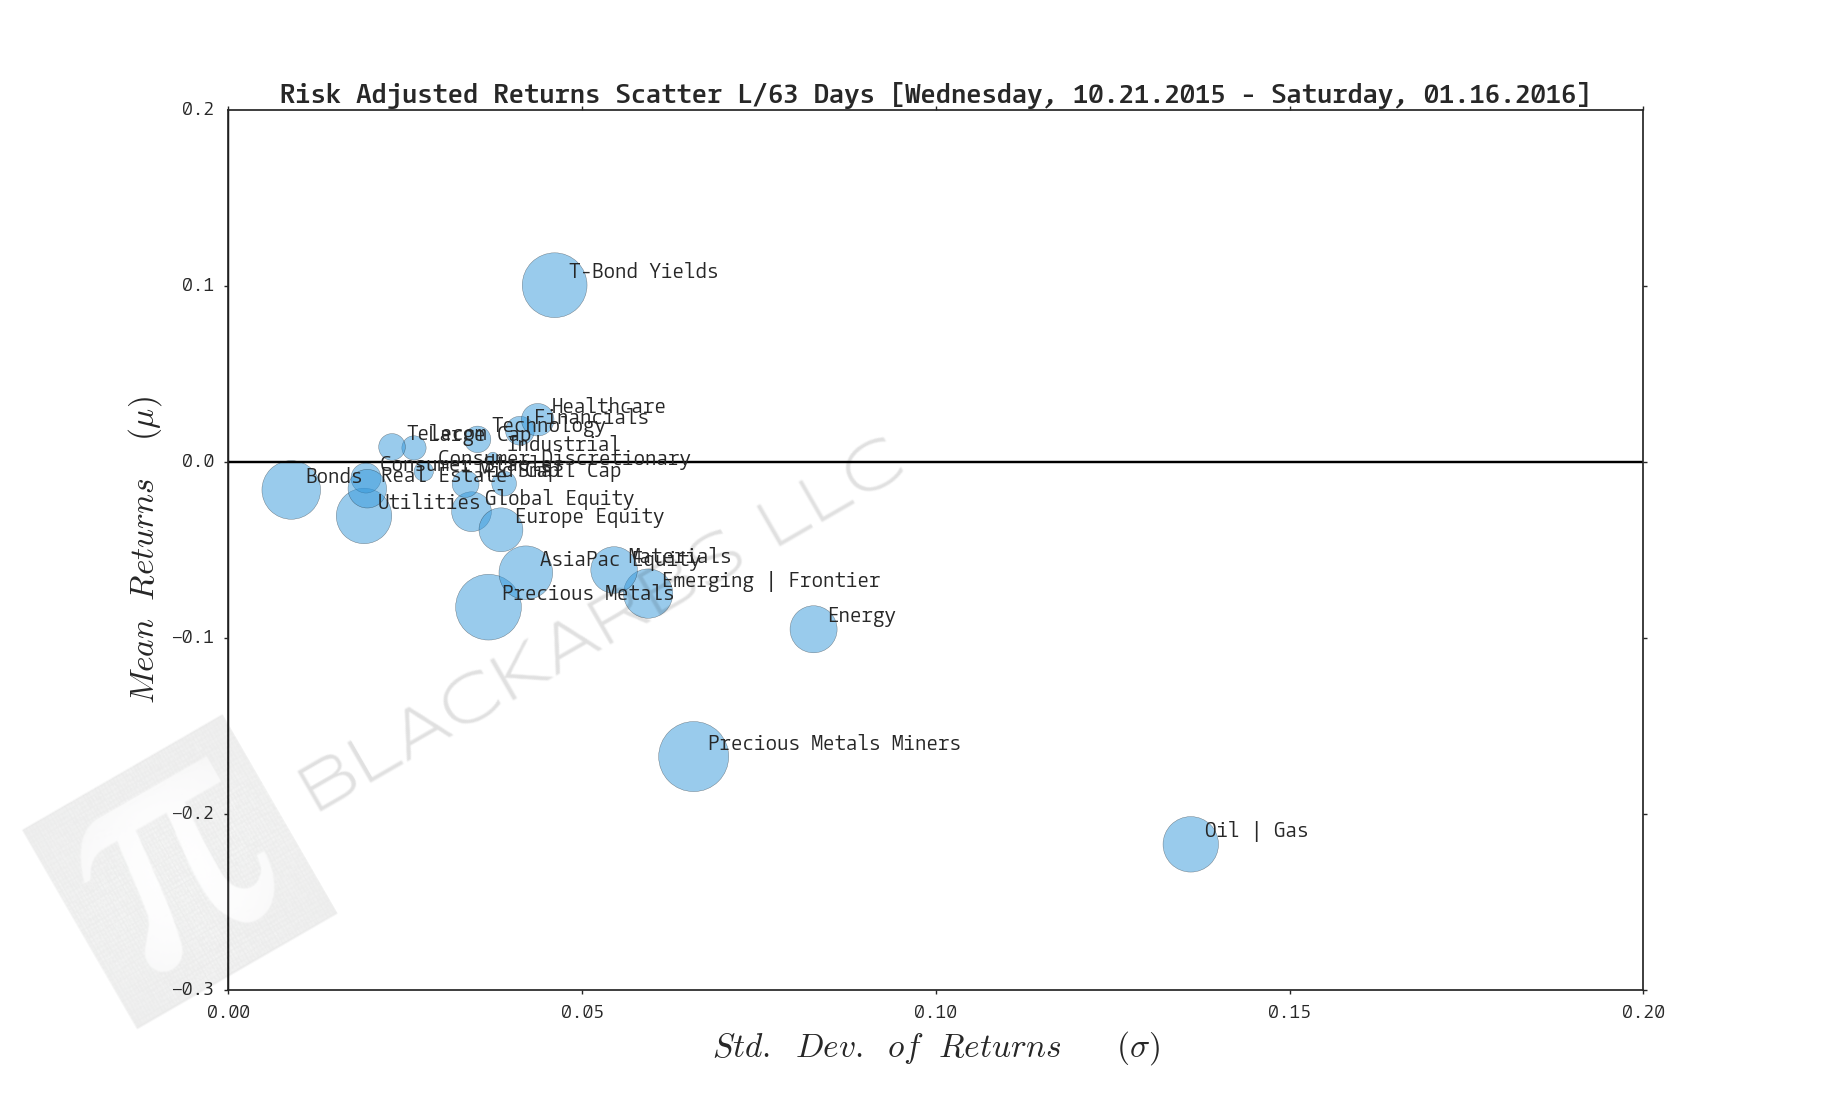
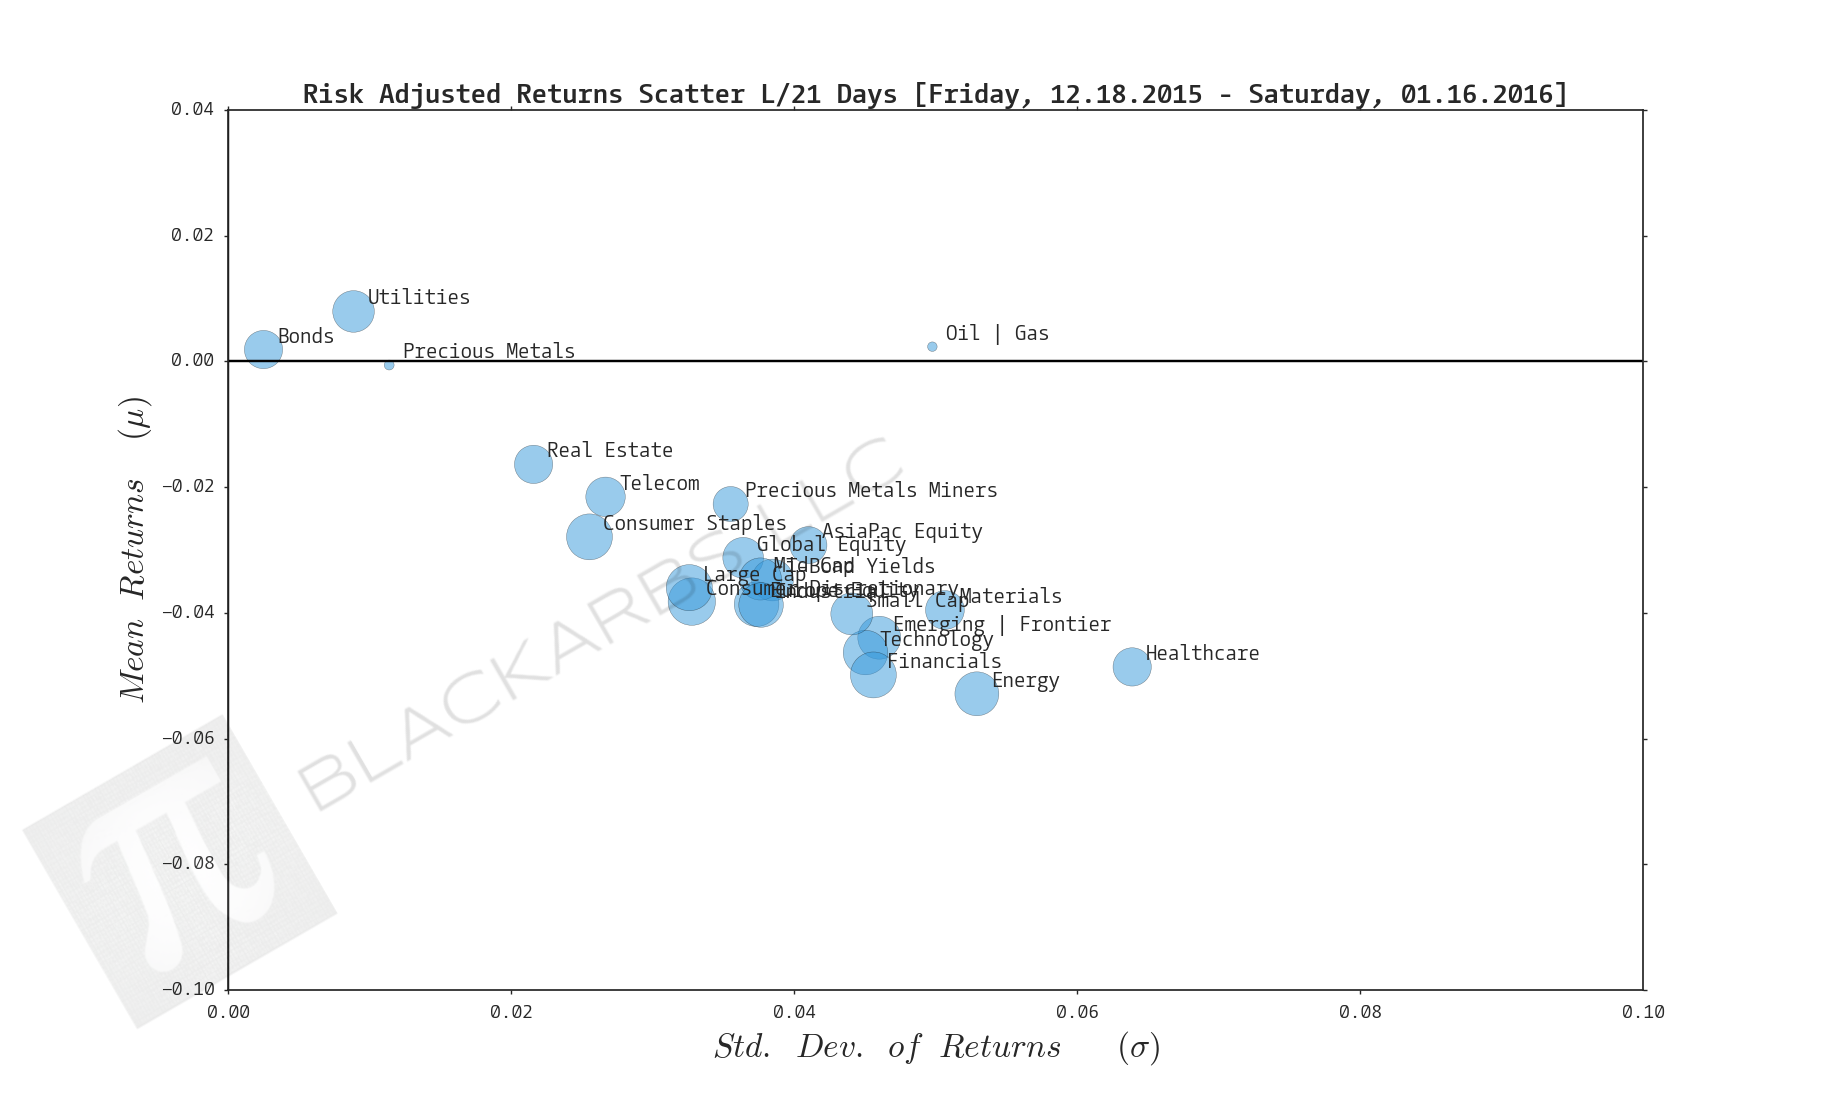
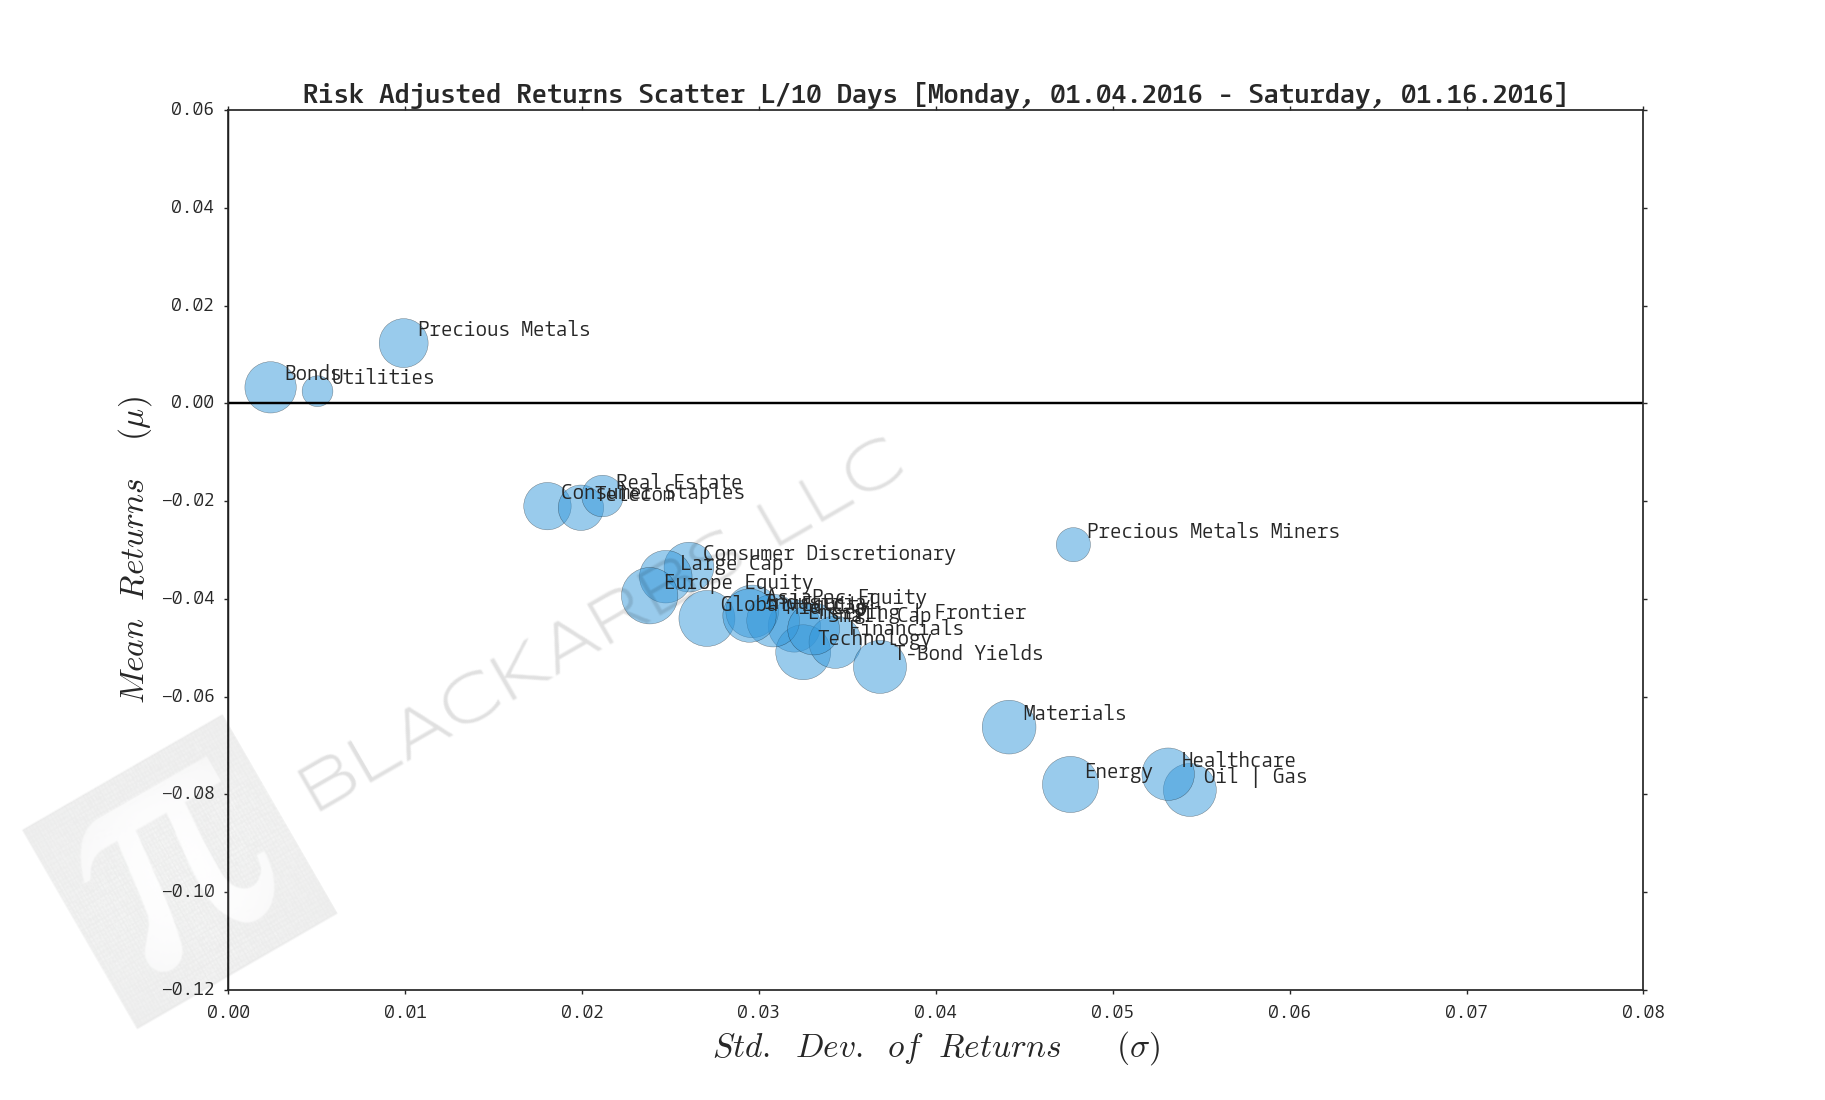
Composite ETF Risk-Adjusted Returns Scatter plot (Std vs Mean)
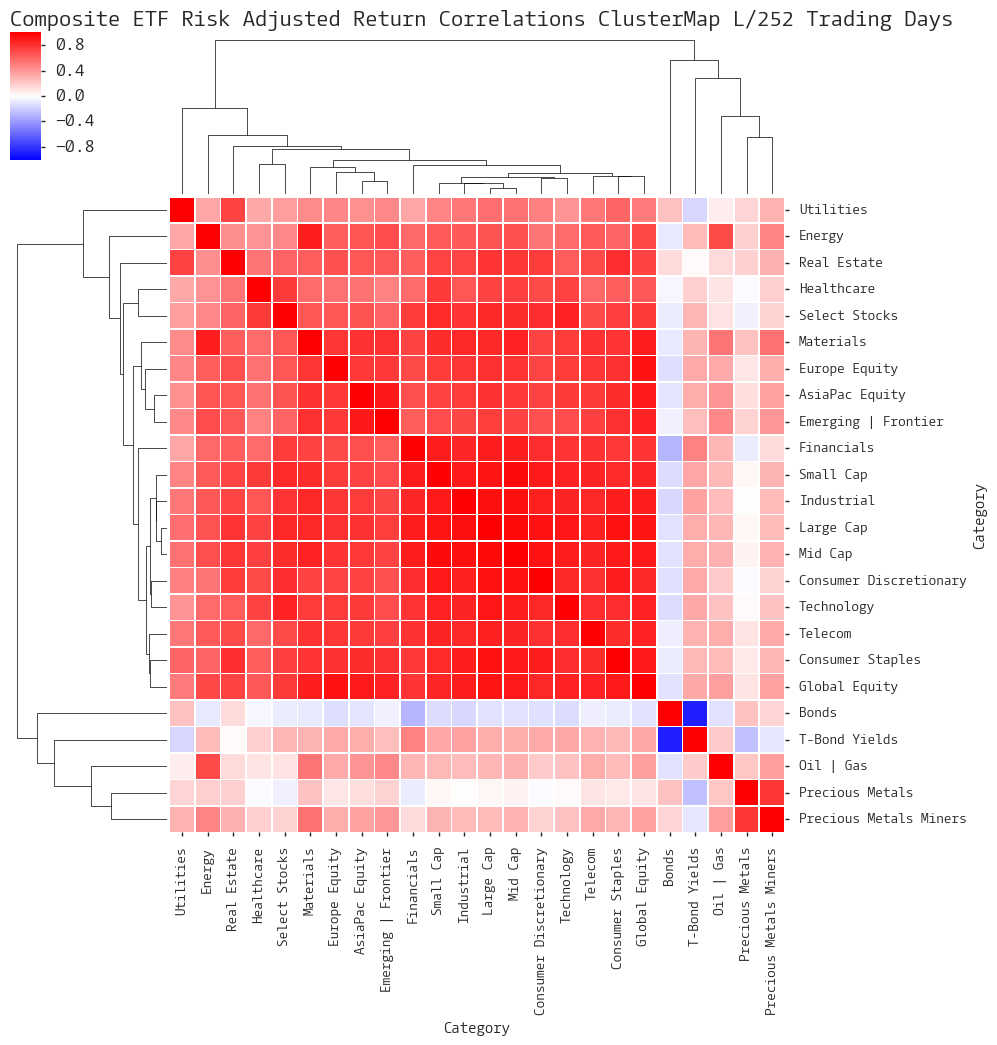
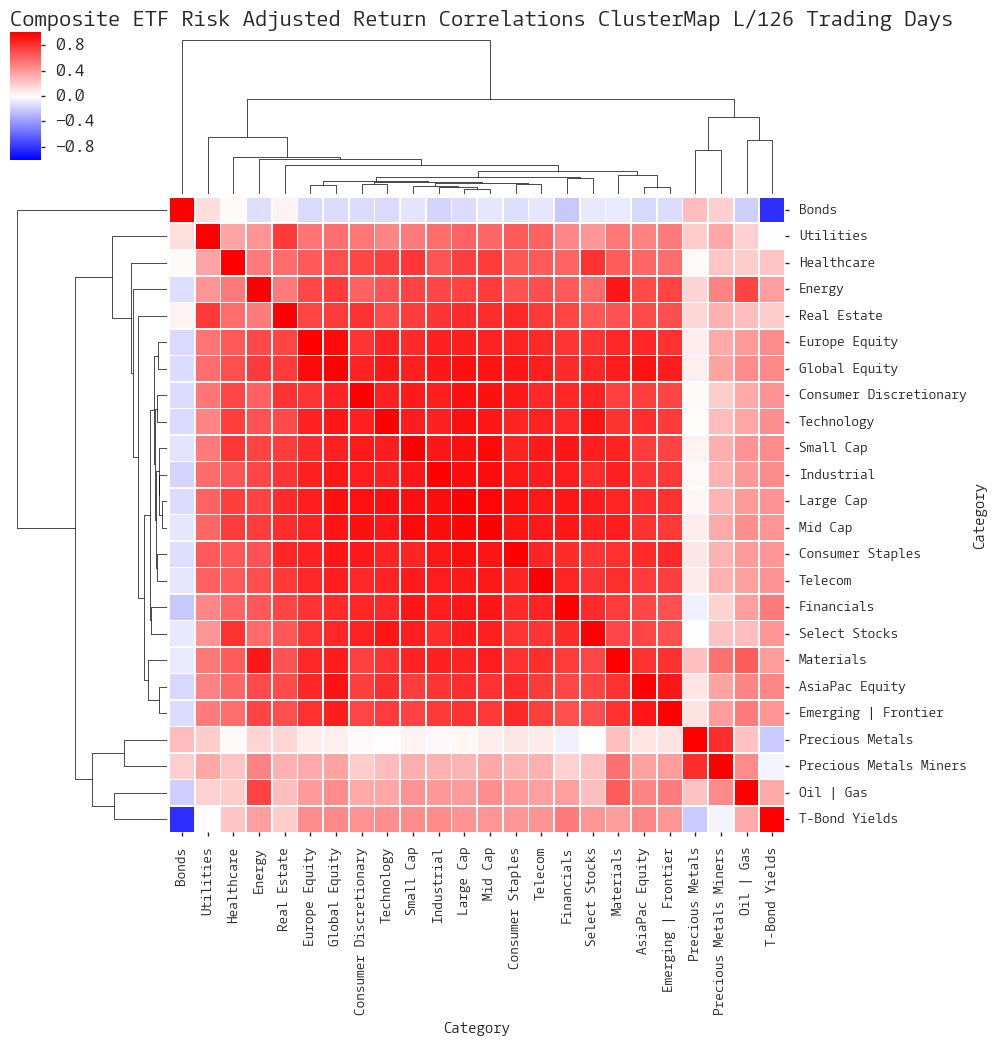
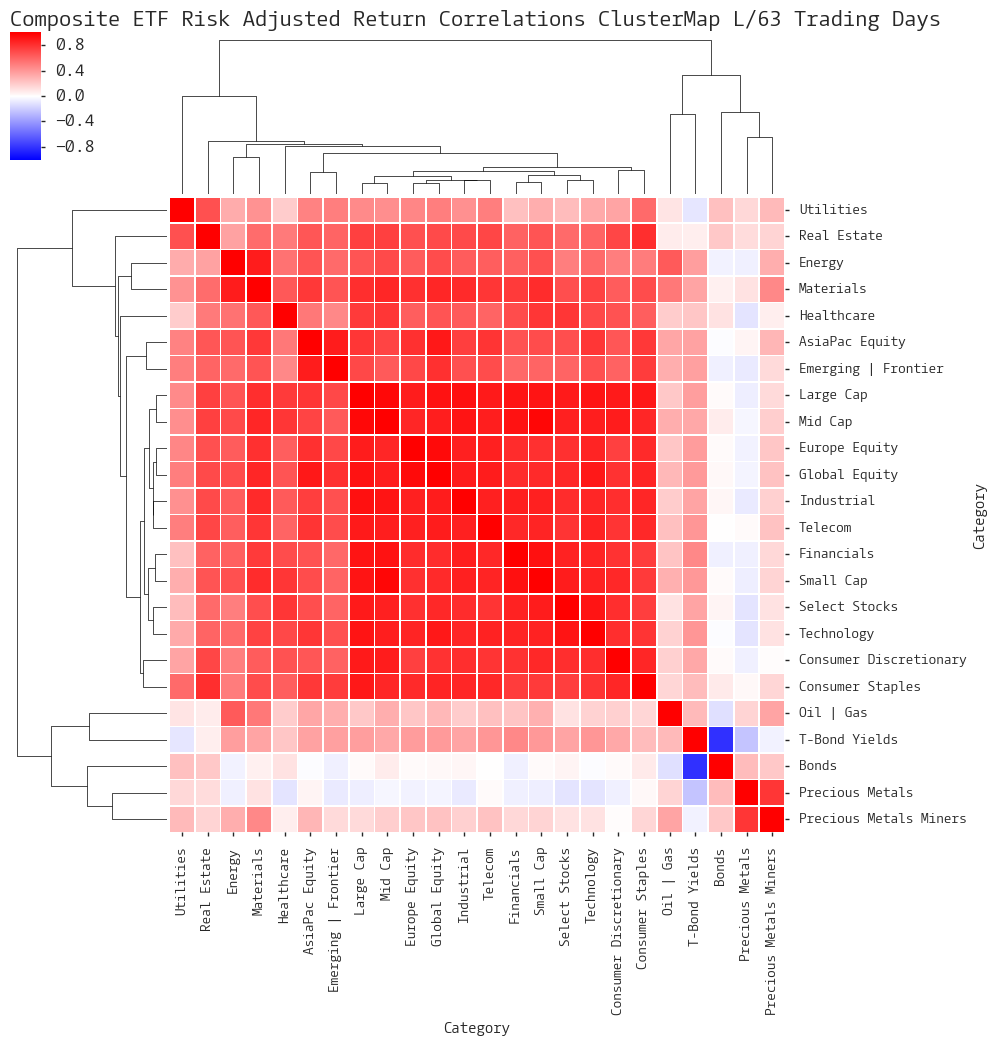
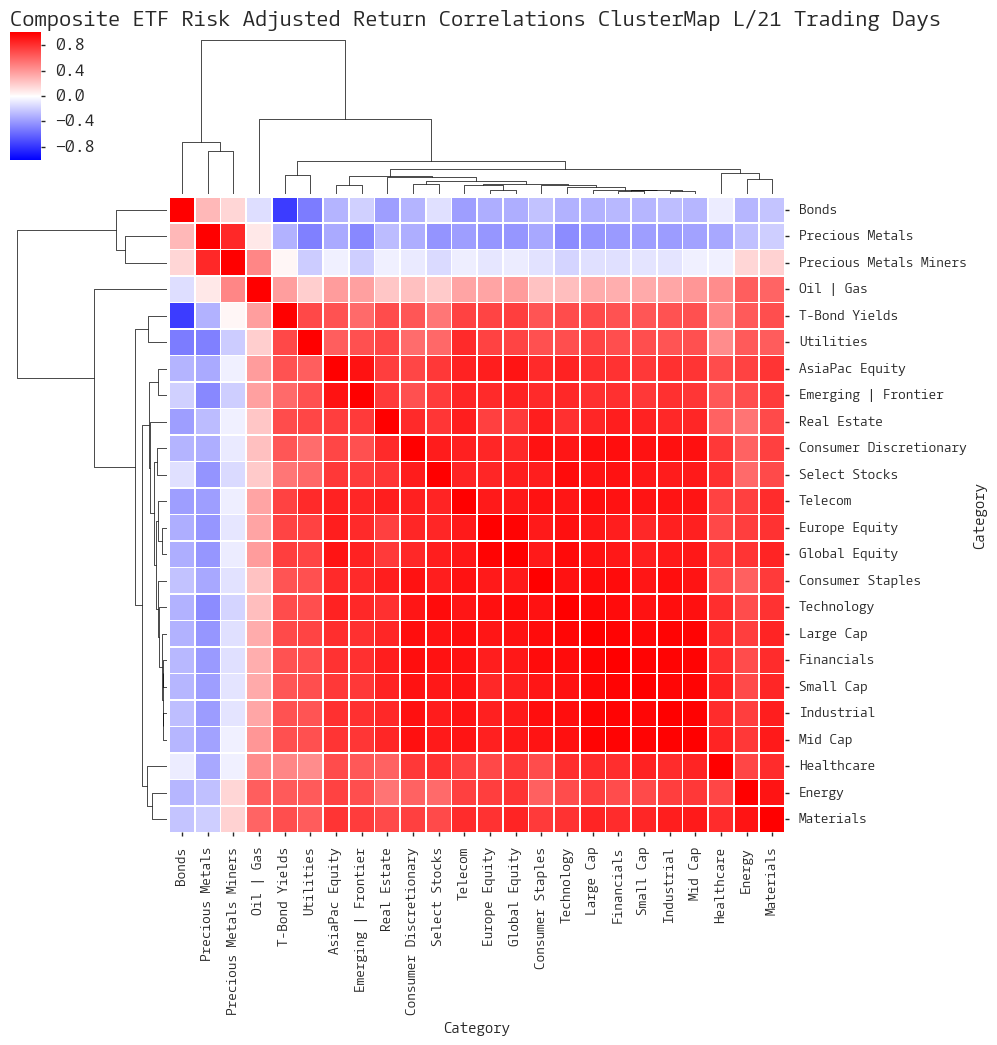
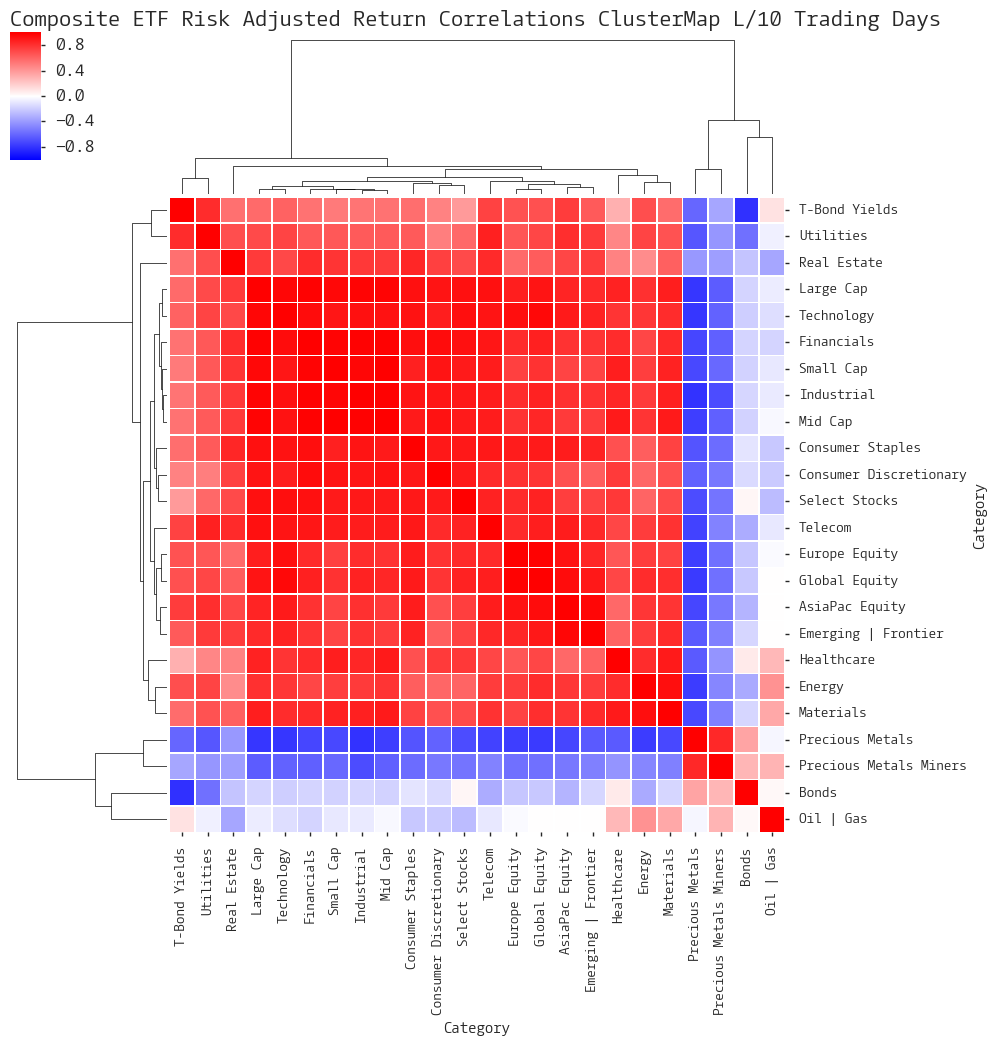
Composite ETF Risk-Adjusted Return Correlations Heatmap (Clusterplot)
Composite ETF Cumulative Return Tables
Notable Trends and Observations
COMPOSITE ETF COMPONENTS:
LAST 252 TRADING DAYS
LAST 126 TRADING DAYS
LAST 63 TRADING DAYS
LAST 21 TRADING DAYS
LAST 10 TRADING DAYS
Cumulative Return Tables:
Notable Observations and Trends:
- Investors have been extremely defensive in recent trading as evidenced by Utilities, Bonds, and Precious Metals making the top 3 performers over the last 21, and 10 day periods.
- Only one composite has had positive cumulative returns over the last 252 days - Treasury Yields. If you're a long investor there have been very few ways to escape the selling outside of moving to cash.
- Flexible investors and traders are making a killing to the short side as selling has been very broad based across sectors.
- We are in a binary risk-on, risk-off phase of investing as evidenced by the increased correlations across sectors and the very high negative correlations of traditional safe havens/crash investments. (Bonds, Precious Metals + Precious Metals Miners)
