'V' is the stock price at time 0, 'B' is the book value of equity at time 0, 'ROE' is return on equity, 'g' is an assumed long term growth rate and 'r' is the cost of equity/capital. The ICC model essentially solves for 'r' given the other inputs.
WHY USE THE IMPLIED COST OF CAPITAL MODEL?
There is ongoing debate regarding the ICC model's application and accuracy as a proxy for expected returns as quoted by Charles C. Y. Wang. As an investor/trader I'm less interested in the academic debate and more intrigued by the intuition behind the model and its practical application as a relative value tool.
I use the ICC model as a relative value measure to identify analyst/institutional expectations and sentiment between different market sectors at a point in time.
For this purpose I believe it provides great insight.
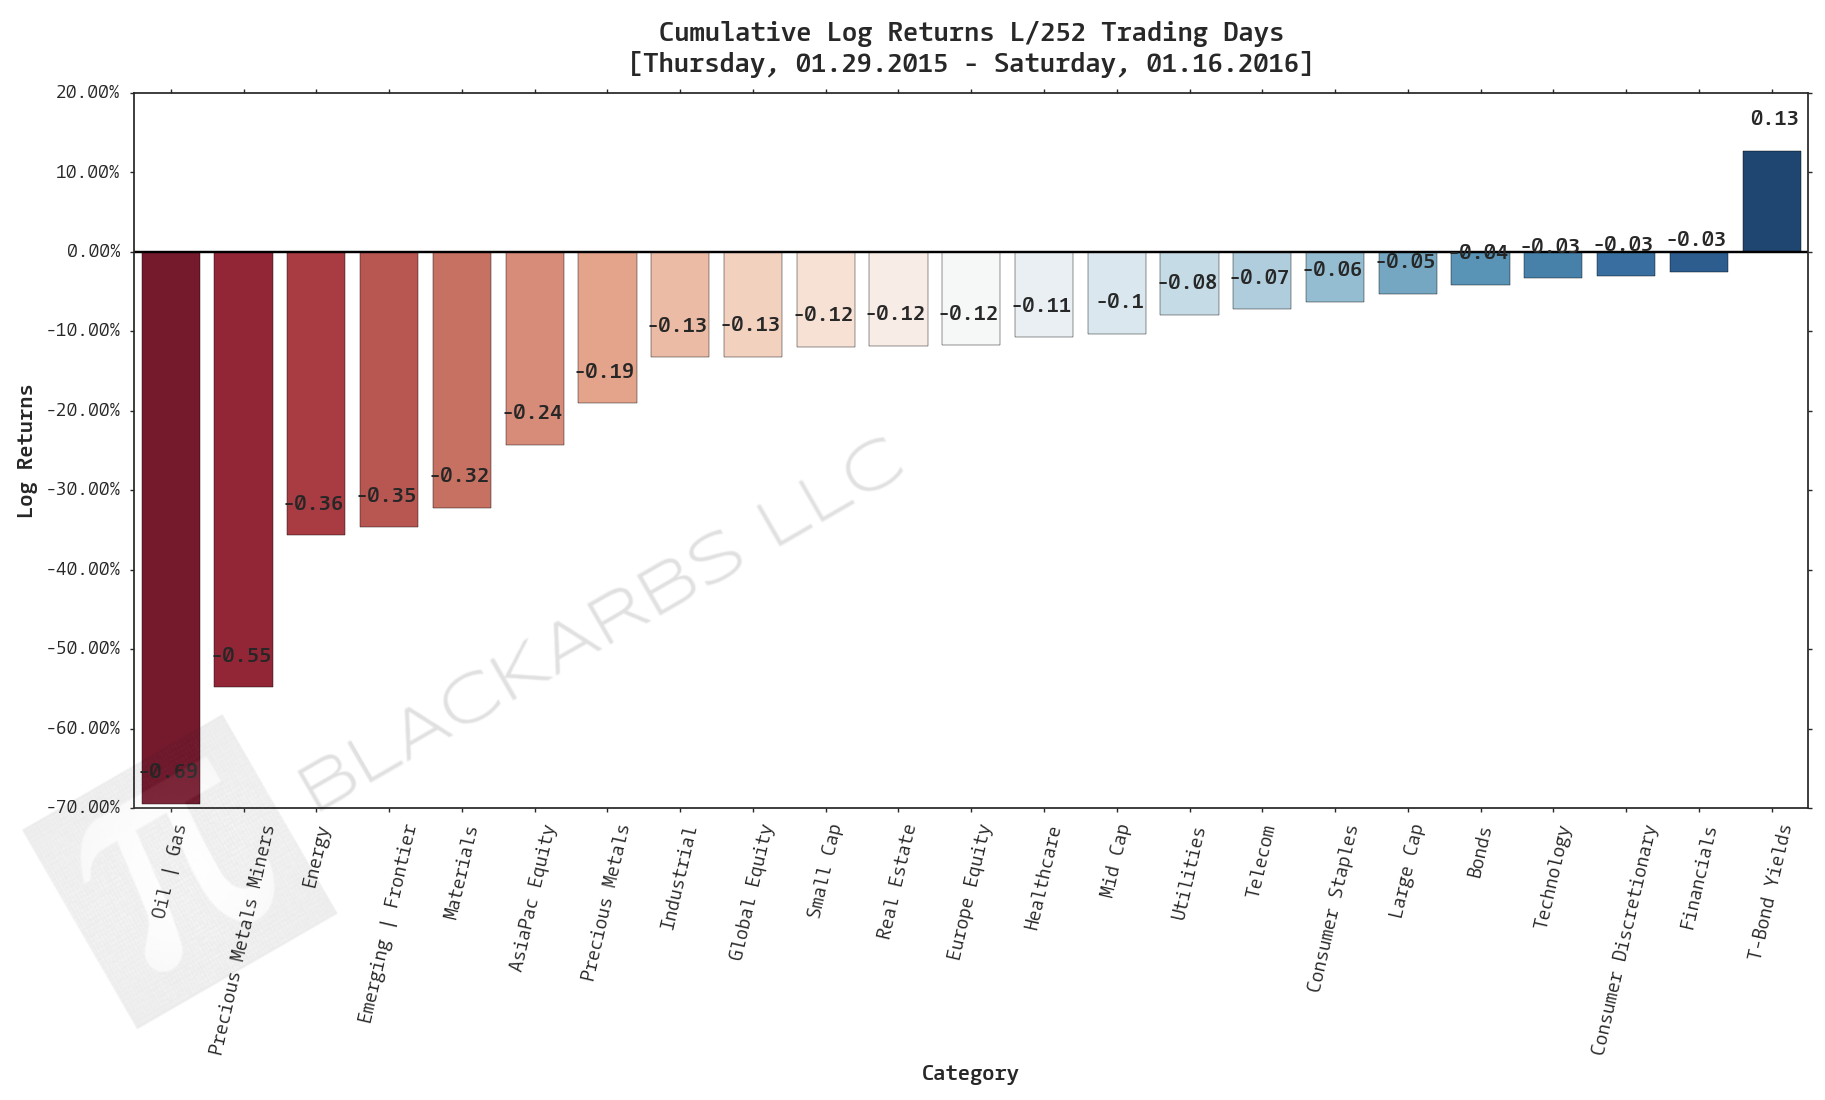
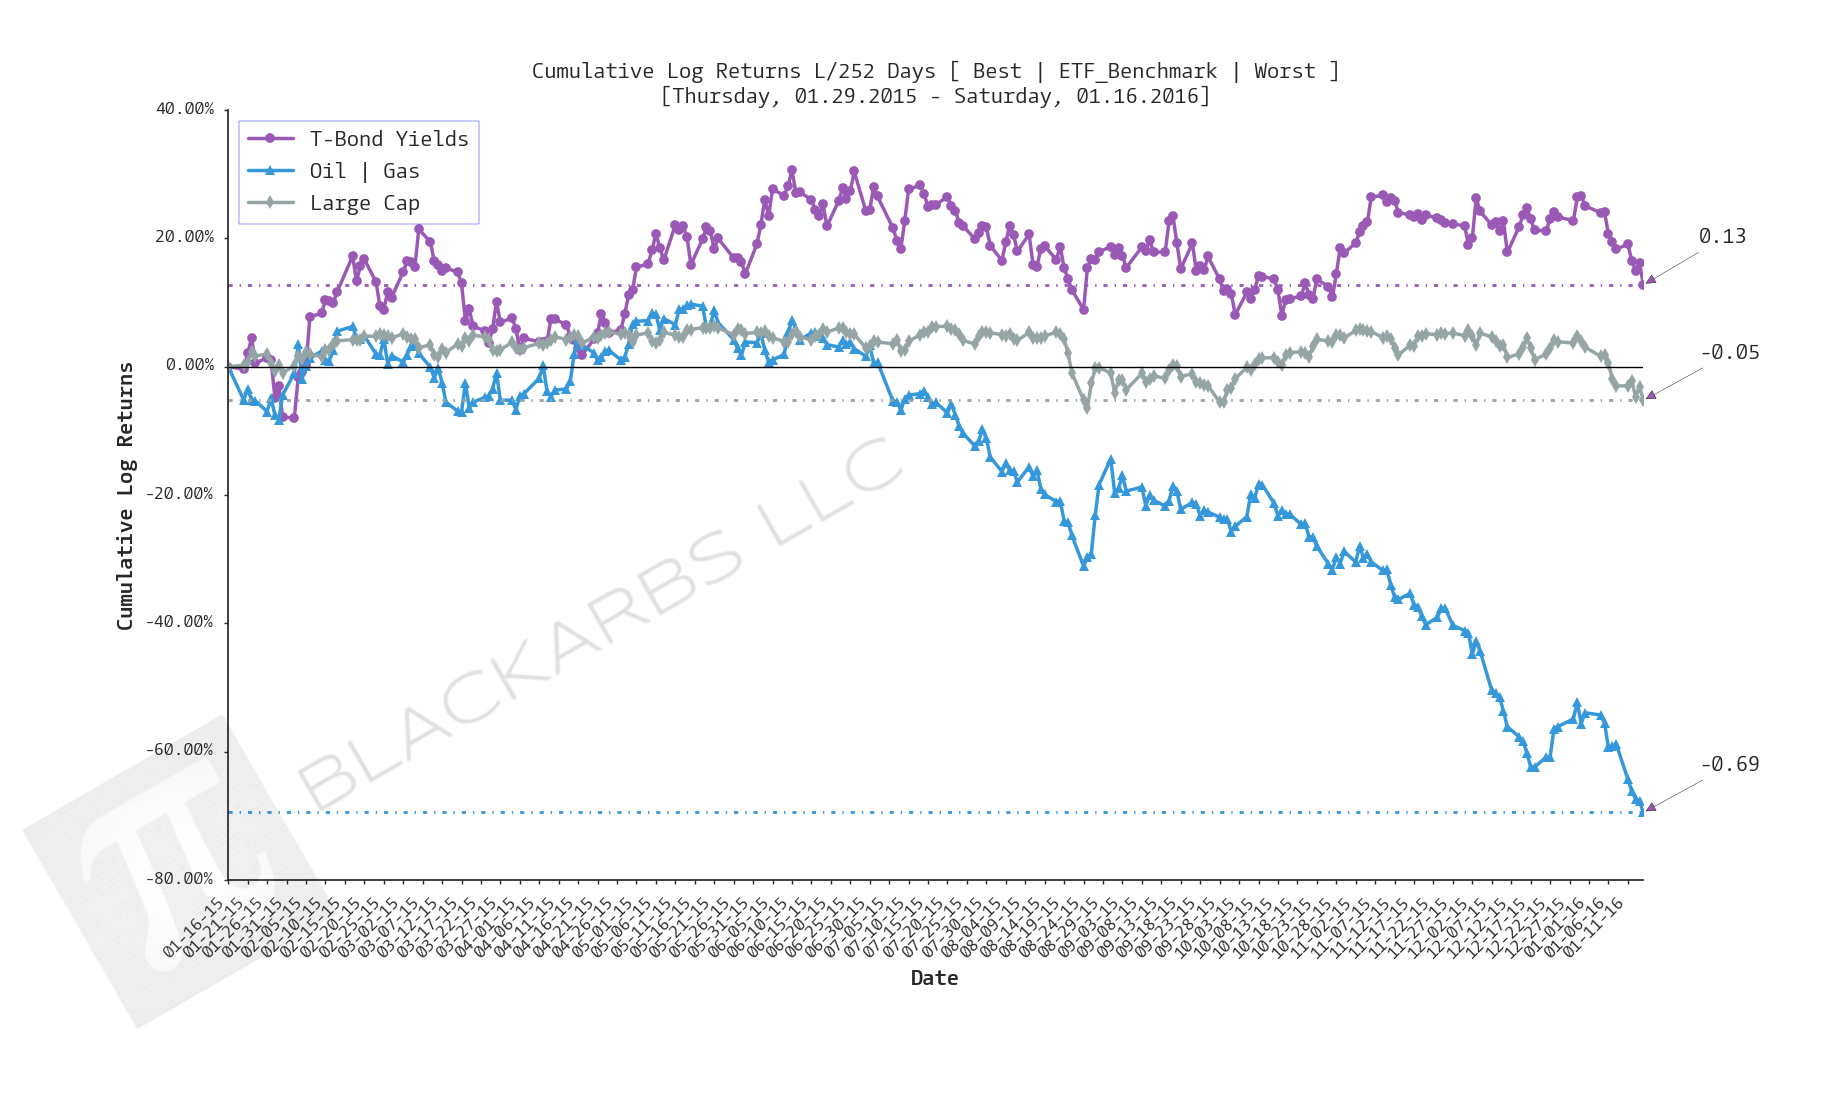
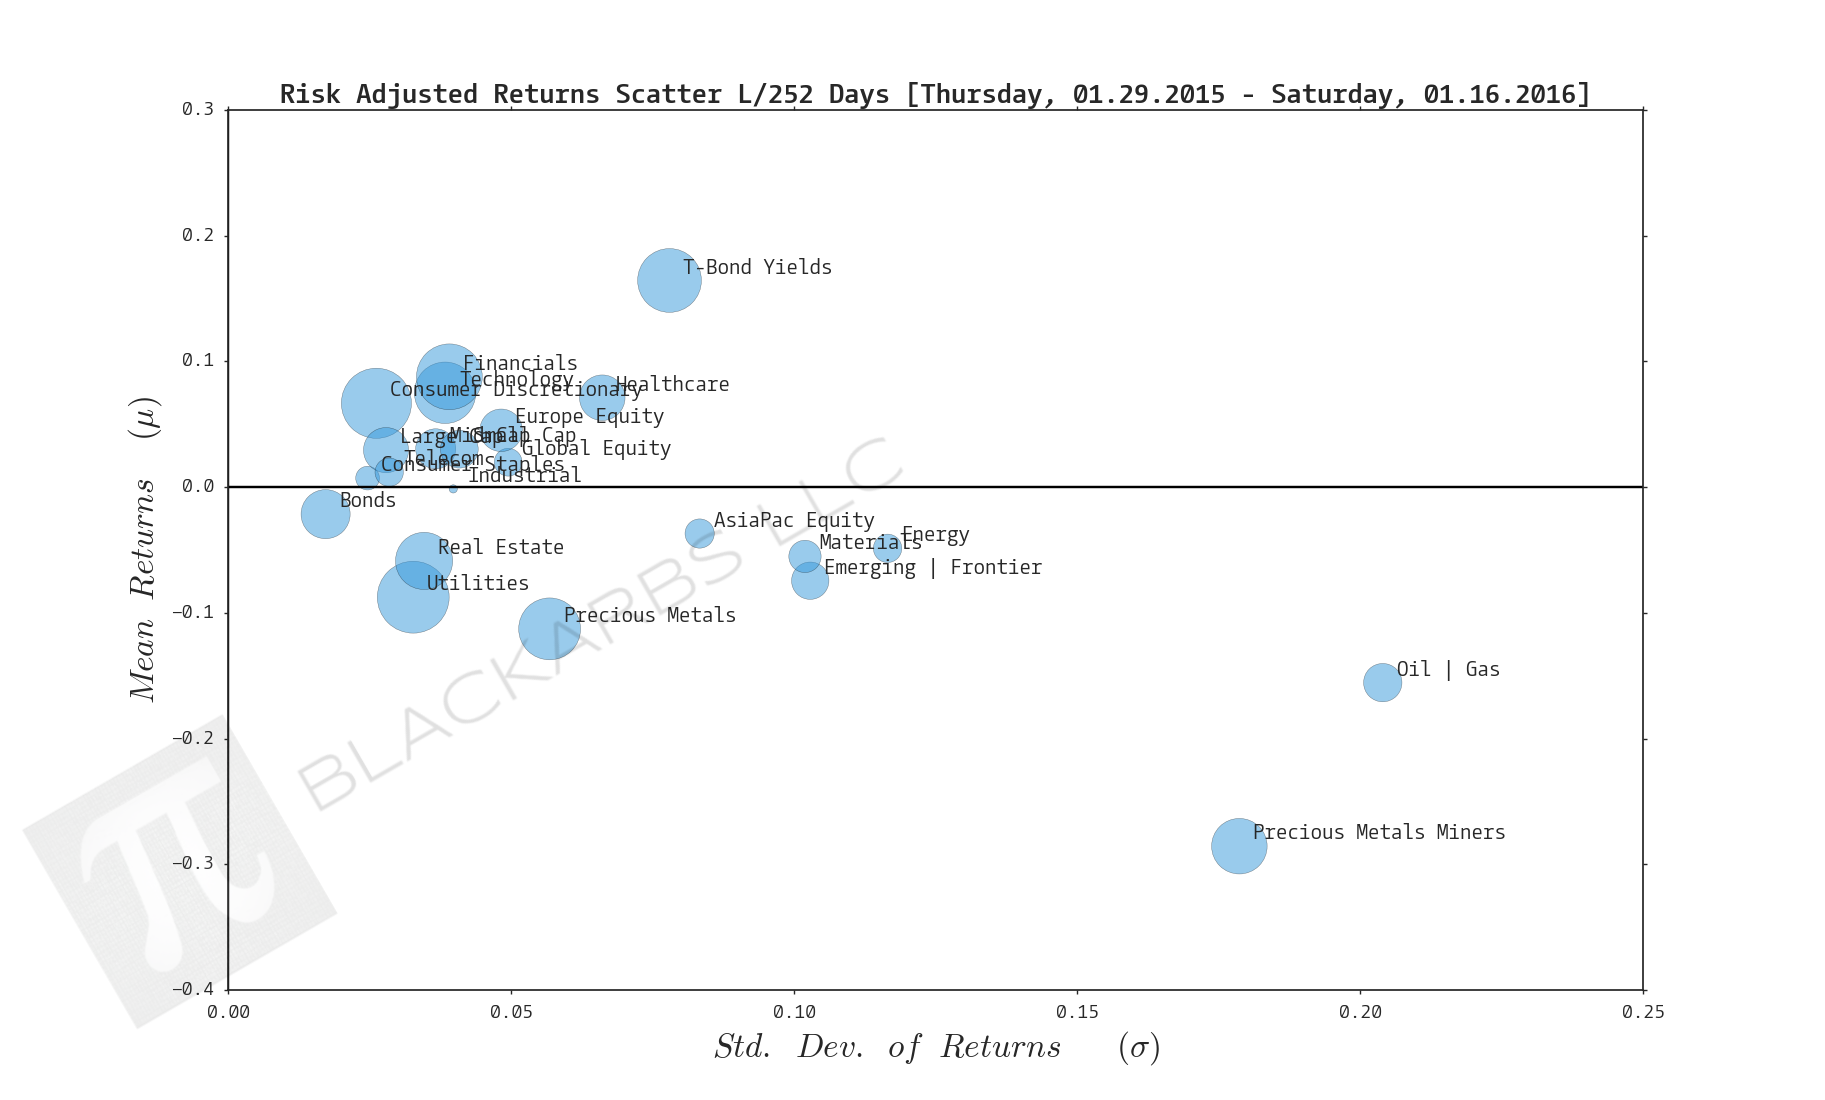
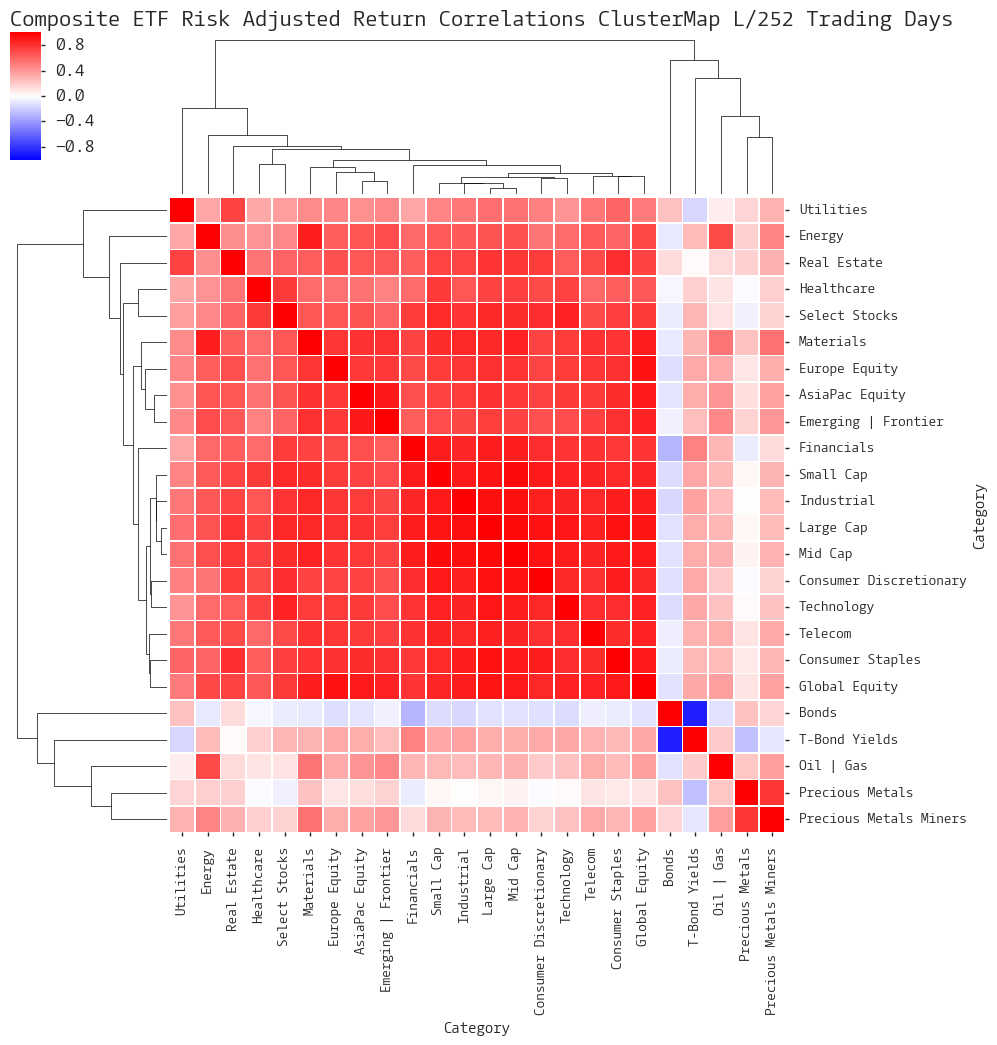
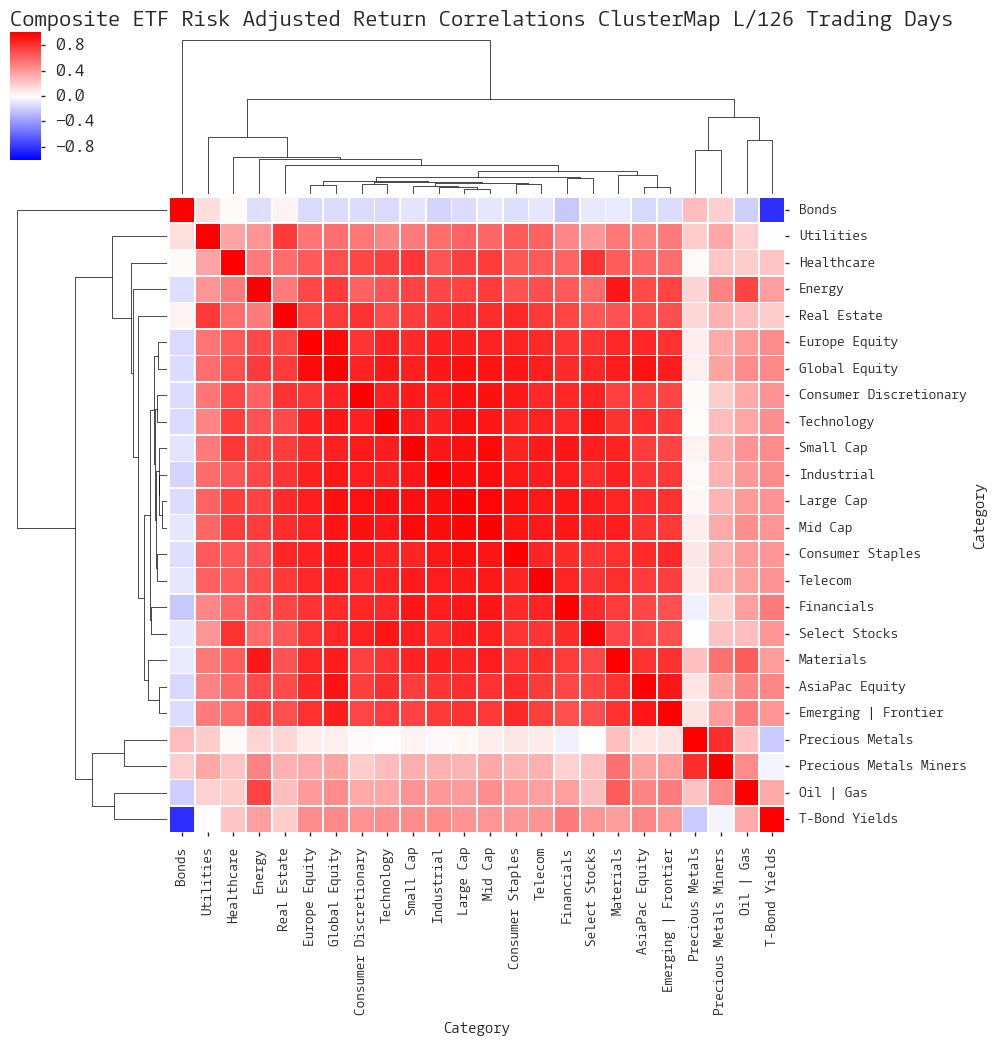
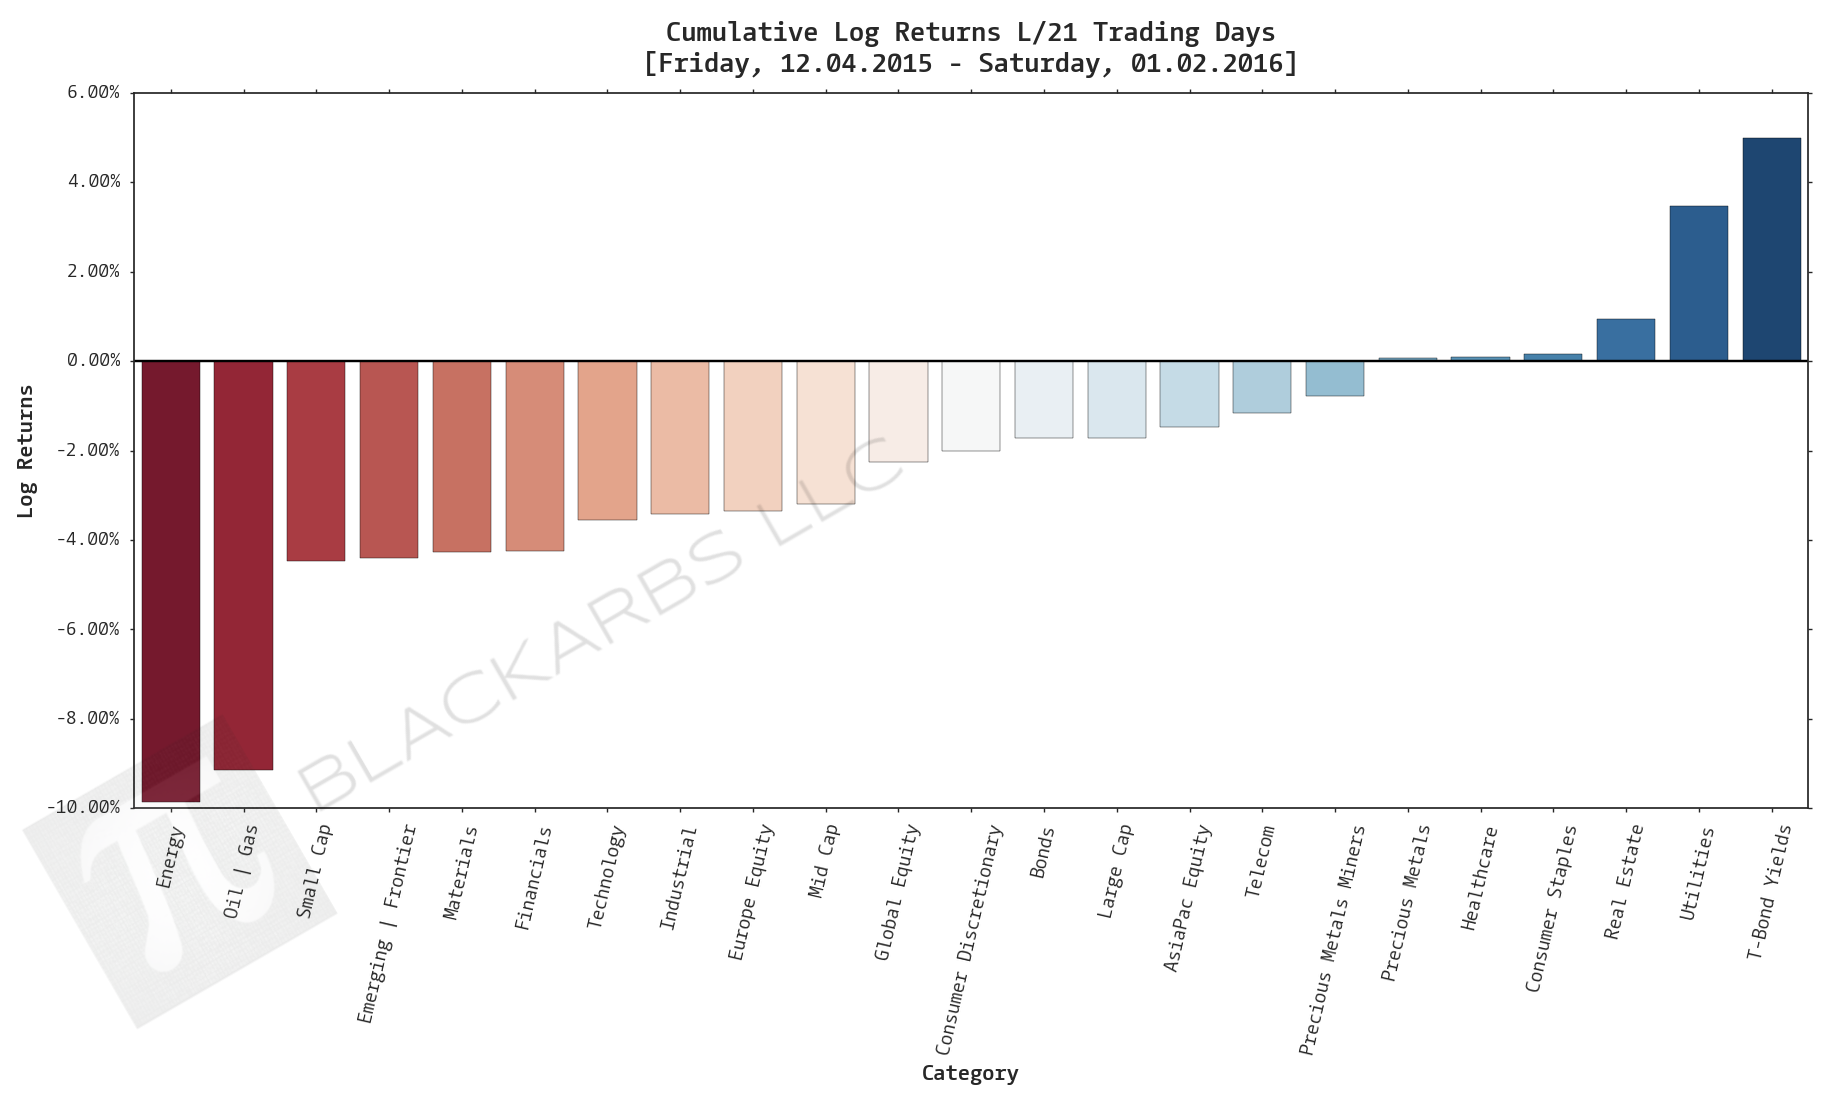
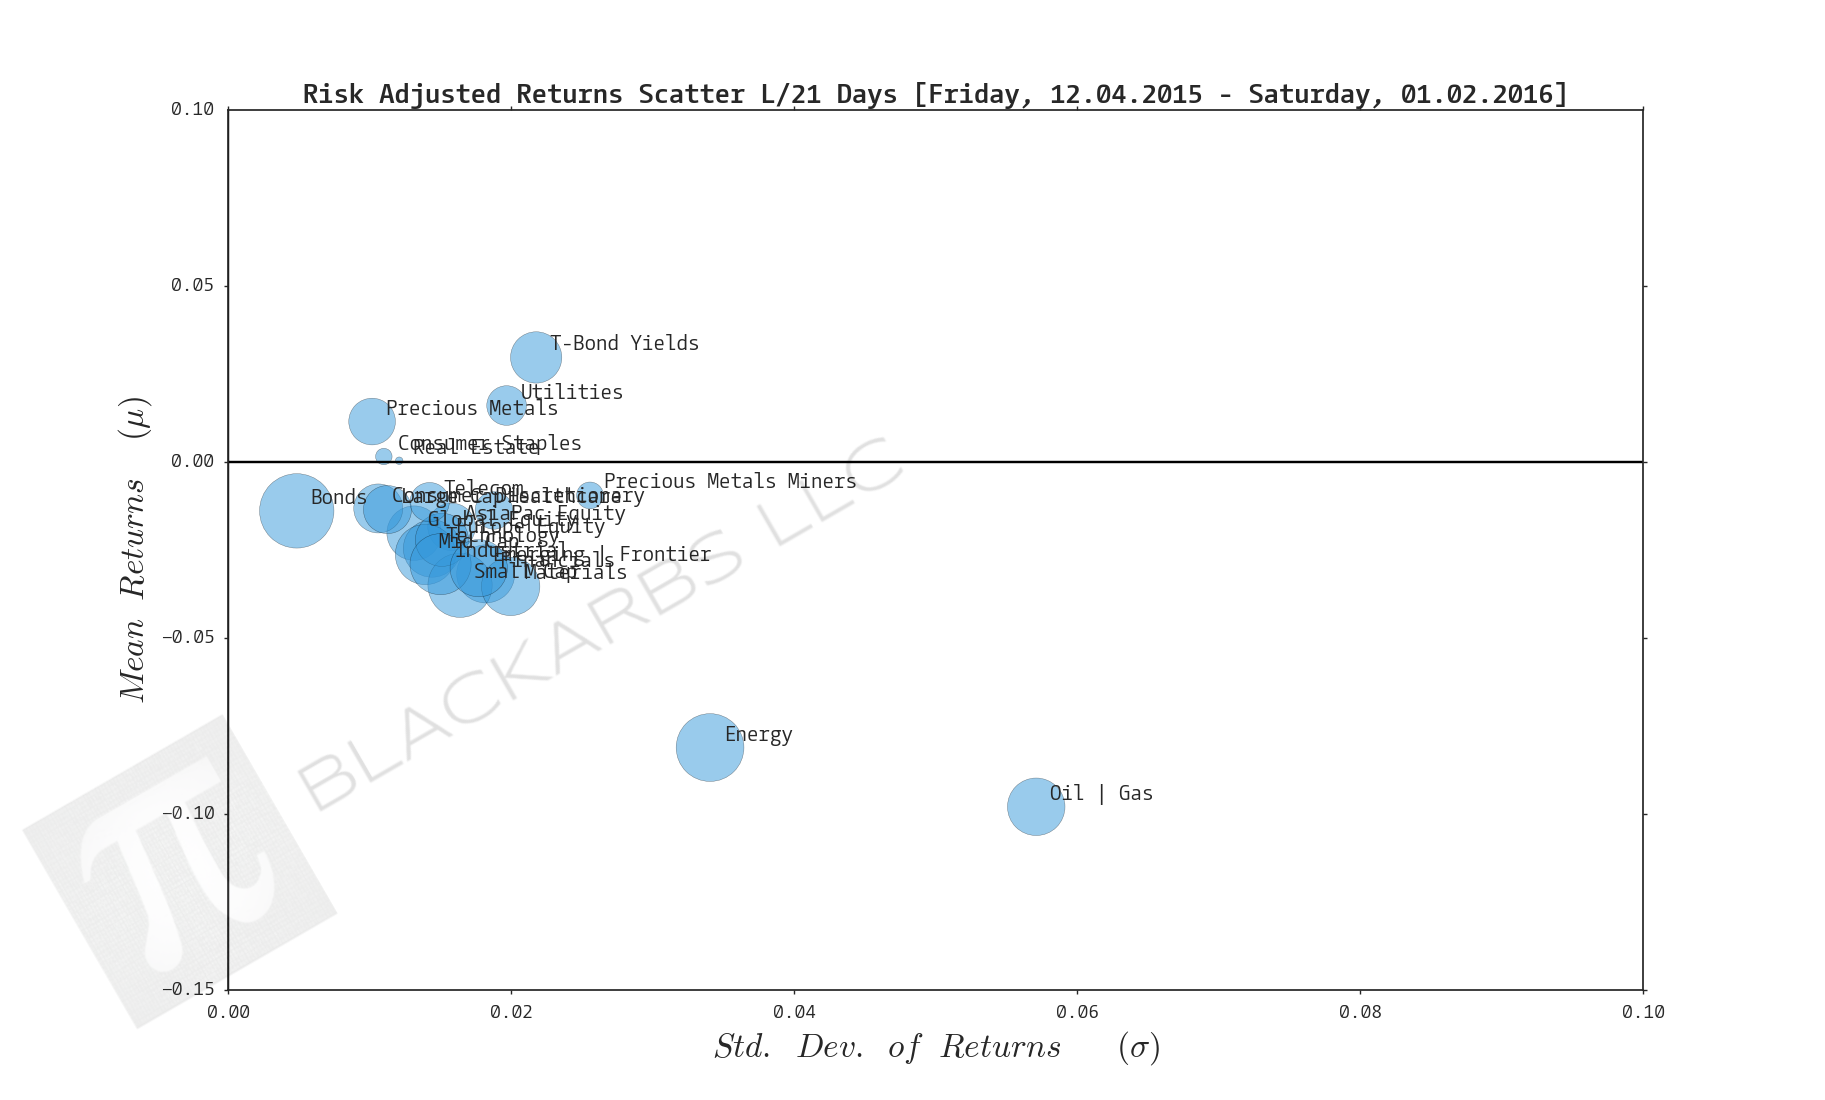
COMPOSITE ETF COMPONENTS FOR ICC ESTIMATES