Guest Post Previously Featured on RectitudeMarket.com (09/02/2015)
/**Note: This post already appeared as a guest post on rectitudemarket.com. The reason I'm posting this article when it is 'outdated', is twofold. 1) I think it's beneficial to review previous works especially when one has the benefit of hindsight. This helps us determine the accuracy and bias of the research presented. 2) I further introduce the concept of conditional cumulative returns, which adds insight to what happens to our securities' returns given some other event occurring. In this case, the event is simply whether our benchmark ETF's cumulative returns are rising or falling during some period.
Are There Any Equity Industry Groups Outperforming During this Recent Market Volatility?
Stock market volatility has picked up in a big way. It has been some time since market participants have experienced consecutive 2-4% up/down moves in the major market averages. The selling has been broad based and market sentiment has deteriorated as well.
With this backdrop I wondered if any industry groups were doing well. By doing well I mean 1) relative outperformance when compared to other industries 2) absolute performance greater than zero.
To answer this question I collected all the NYSE and Nasdaq symbols (~3300 symbols), filtered them for firms with a market cap greater than $300 million then I grouped them by industry. I dropped any industries with less than 10 stock symbols. With the filtered dataset I ran the analysis.
First I examined the cumulative return momentum over various lookback periods. Then I examined which industry groups had the best cumulative return performance given a benchmark ETF’s returns are rising (declining).
The benchmark ETF’s I selected for comparison are (SPY, QQQ, VTI).
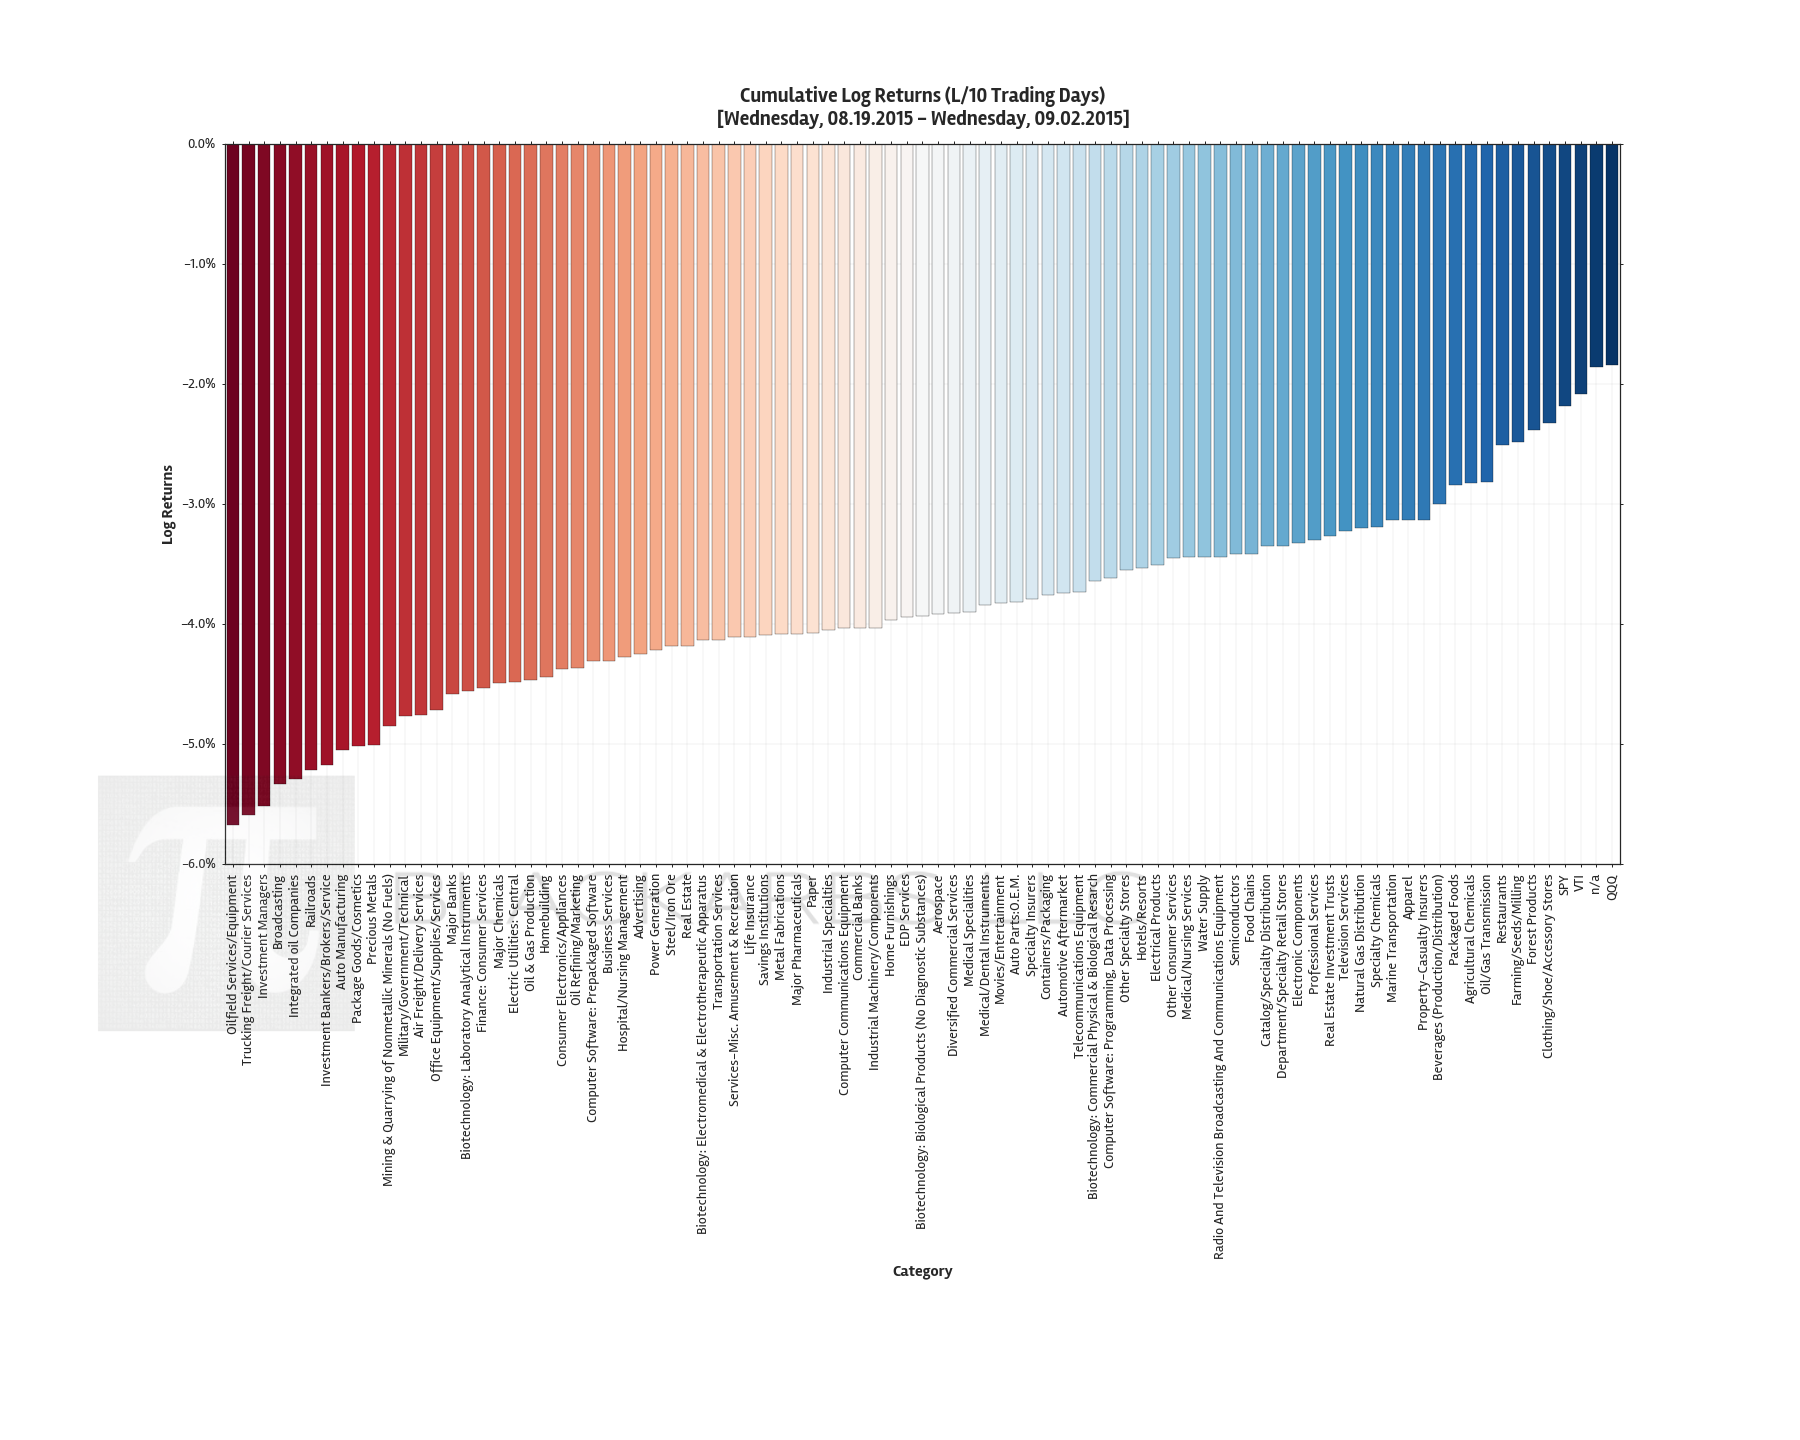
Unfortunately there are no industry groups with absolute cumulative return performance greater than zero over the last quarterly period (Last 63 Trading Days).

In fact you'd have to back out to view industry group performance Year-to-Date, to find any industry groups with positive cumulative returns. Those industries are: Biotechnology: Commercial Physical & Biological Research, Medical/Nursing Services, Forest Products, and Movies/Entertainment.

To examine relative conditional performance, I selected the top 5% of industry group cumulative return performance given increasing benchmark returns (Last 63 Trading Days)

Focusing on SPY, the strongest performers given increasing returns have been: Finance: Consumer Services, Investment Bankers/Brokers/Service, Investment Managers, and Clothing/Shoe/Accessory Stores. Clearly financial firms’ returns are highly sensitive to the performance of SPY. Somewhat surprisingly Clothing/Shoe/Accessory Stores have outperformed given increasing returns in all 3 benchmark ETFs.
For long only investors, unfortunately there are no industries which have recorded positive absolute cumulative return performance given a decline in benchmark returns. The best one can hope for is to find industries that decline less than peers during periods of negative market returns.
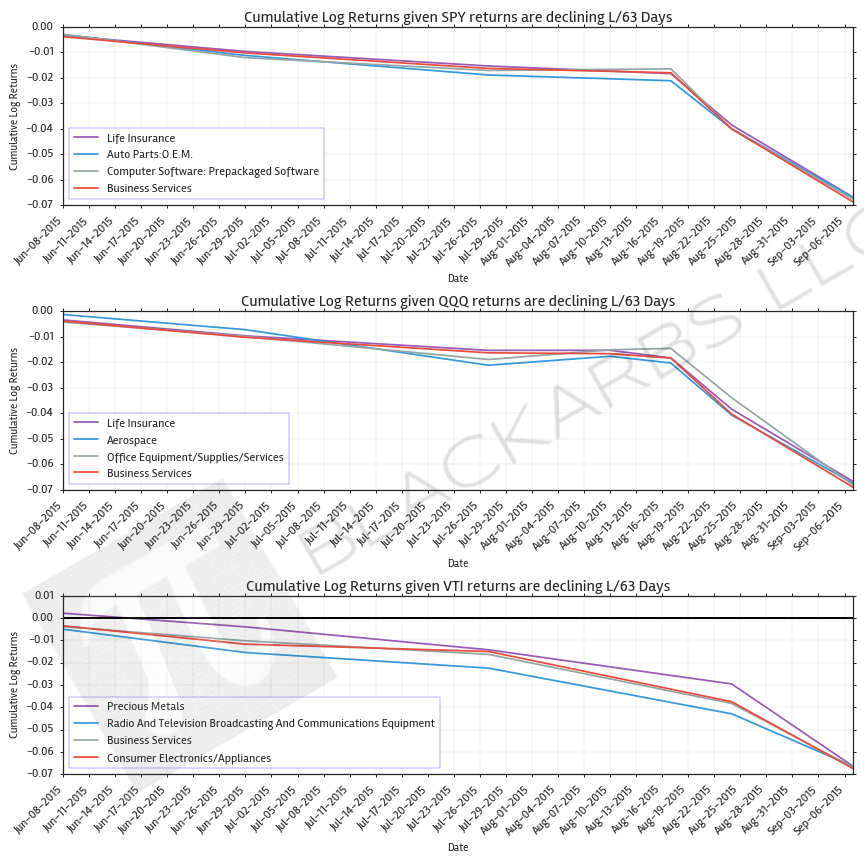
During the last quarter (Last 63 Trading Days) the best industry performance given declining returns in SPY are: Life Insurance, Auto Parts 0.E.M., Computer Software: Prepackaged Software, and Business Services. I find it surprising that Business Services would be a relative outperformer for all 3 benchmark ETFs.
Another item of note is precious metals being a relative outperformer if VTI returns are declining. I think this makes sense given that VTI is representative of the entire domestic equity market, therefore negative returns in this index is more likely to induce catastrophe hedges and/or ‘panic trades’.
If your portfolio has been hit during this period of heightened volatility take solace in knowing you are not alone. No industry is safe. However, all is not lost, by creating a shopping list of your favorite quality names now on discount, you can be ready to strike with conviction when the proper opportunity presents itself.