

COMPOSITE MACRO ETF WEEKLY IMPLIED COST-OF-CAPITAL ESTIMATES VS. CUMULATIVE RETURNS (1/30/16)
/WHAT IS THE "IMPLIED COST OF CAPITAL (ICC)" MODEL?
“In accounting and finance the implied cost of equity capital (ICC)—defined as the internal rate of return that equates the current stock price to discounted expected future dividends—is an increasingly popular class of proxies for the expected rate of equity returns. ”
— CHARLES C. Y. WANG; an assistant professor of business administration in the Accounting and Management Unit at Harvard Business School
The basic concept of the ICC model is that it is a forward looking estimate of the implied earnings growth rate of stock given the current stock price. It is calculated using a combination of equity book value and earnings forecasts.
To see a more involved explanation of the previous model I used see here.
In the past I used a Multi-Stage Residual Income Model. However, this time around I've decided to use a simpler Single-Stage Residual Income Model for these estimates. I chose this because I believe the additional complexity is not warranted given my purpose which I will elaborate on further.
The Single-Stage Residual Income Model as defined by the CFA Institute is the following:
source: CFA Institute
'V' is the stock price at time 0, 'B' is the book value of equity at time 0, 'ROE' is return on equity, 'g' is an assumed long term growth rate and 'r' is the cost of equity/capital. The ICC model essentially solves for 'r' given the other inputs.
WHY USE THE IMPLIED COST OF CAPITAL MODEL?
There is ongoing debate regarding the ICC model's application and accuracy as a proxy for expected returns as quoted by Charles C. Y. Wang. As an investor/trader I'm less interested in the academic debate and more intrigued by the intuition behind the model and its practical application as a relative value tool.
I use the ICC model as a relative value measure to identify analyst/institutional expectations and sentiment between different market sectors at a point in time.
For this purpose I believe it provides great insight.
COMPOSITE ETF COMPONENTS FOR ICC ESTIMATES
Z-SCORE ICC ESTIMATES AND CUMULATIVE RETURNS COMPARISON CHART
The below plot gives visual representation of the ICC estimates. I z-scored both year-to-date cumulative returns and the ICC estimates so we can view them on the same scale. Examining this chart allows investors to quickly determine which market sectors are outperforming (underperforming) their respective Implied Cost of Capital Estimates.
The extreme cases show where there are disconnects between the analyst community's forward earnings expectations and actual market performance. The plot is sorted left to right by ascending ICC estimates.
LAST 252 TRADING DAYS
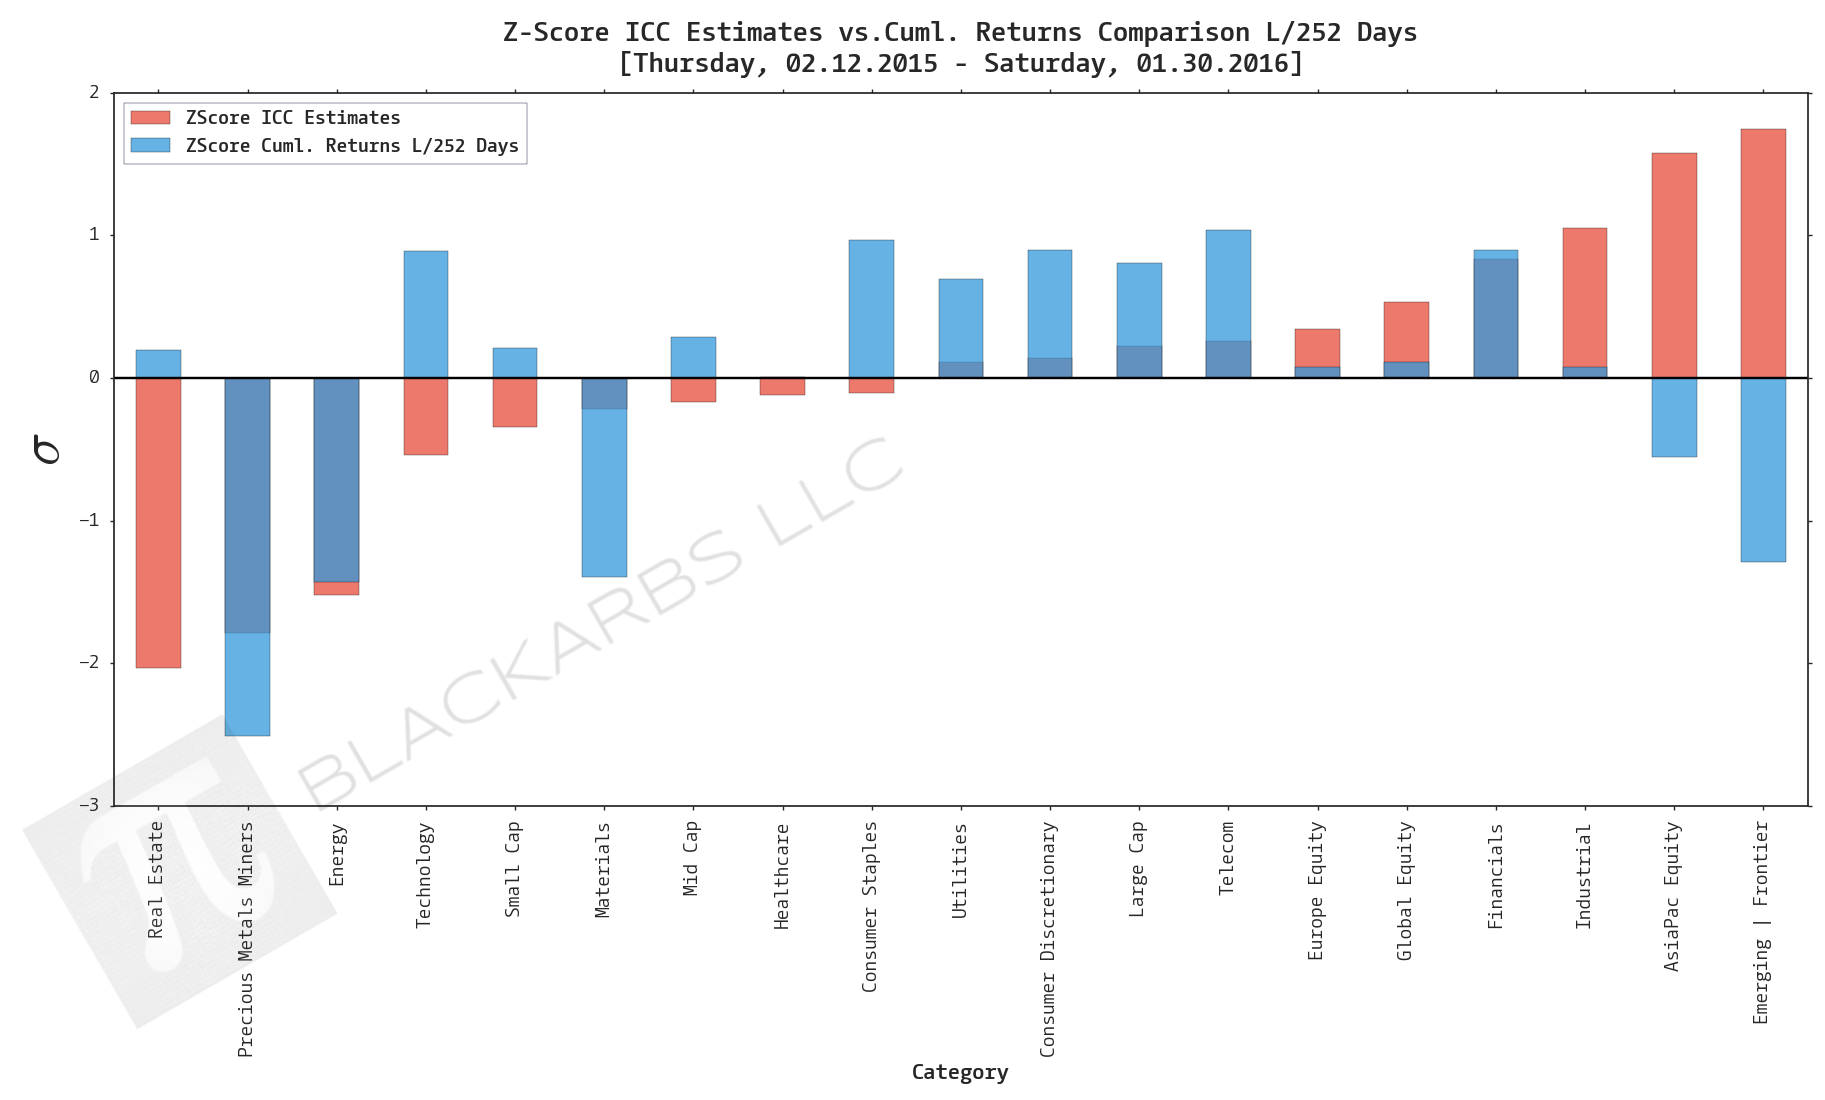
Data Sources: YCharts.com, Yahoo Finance
LAST 126 TRADING DAYS

Data Sources: YCharts.com, Yahoo Finance
LAST 63 TRADING DAYS
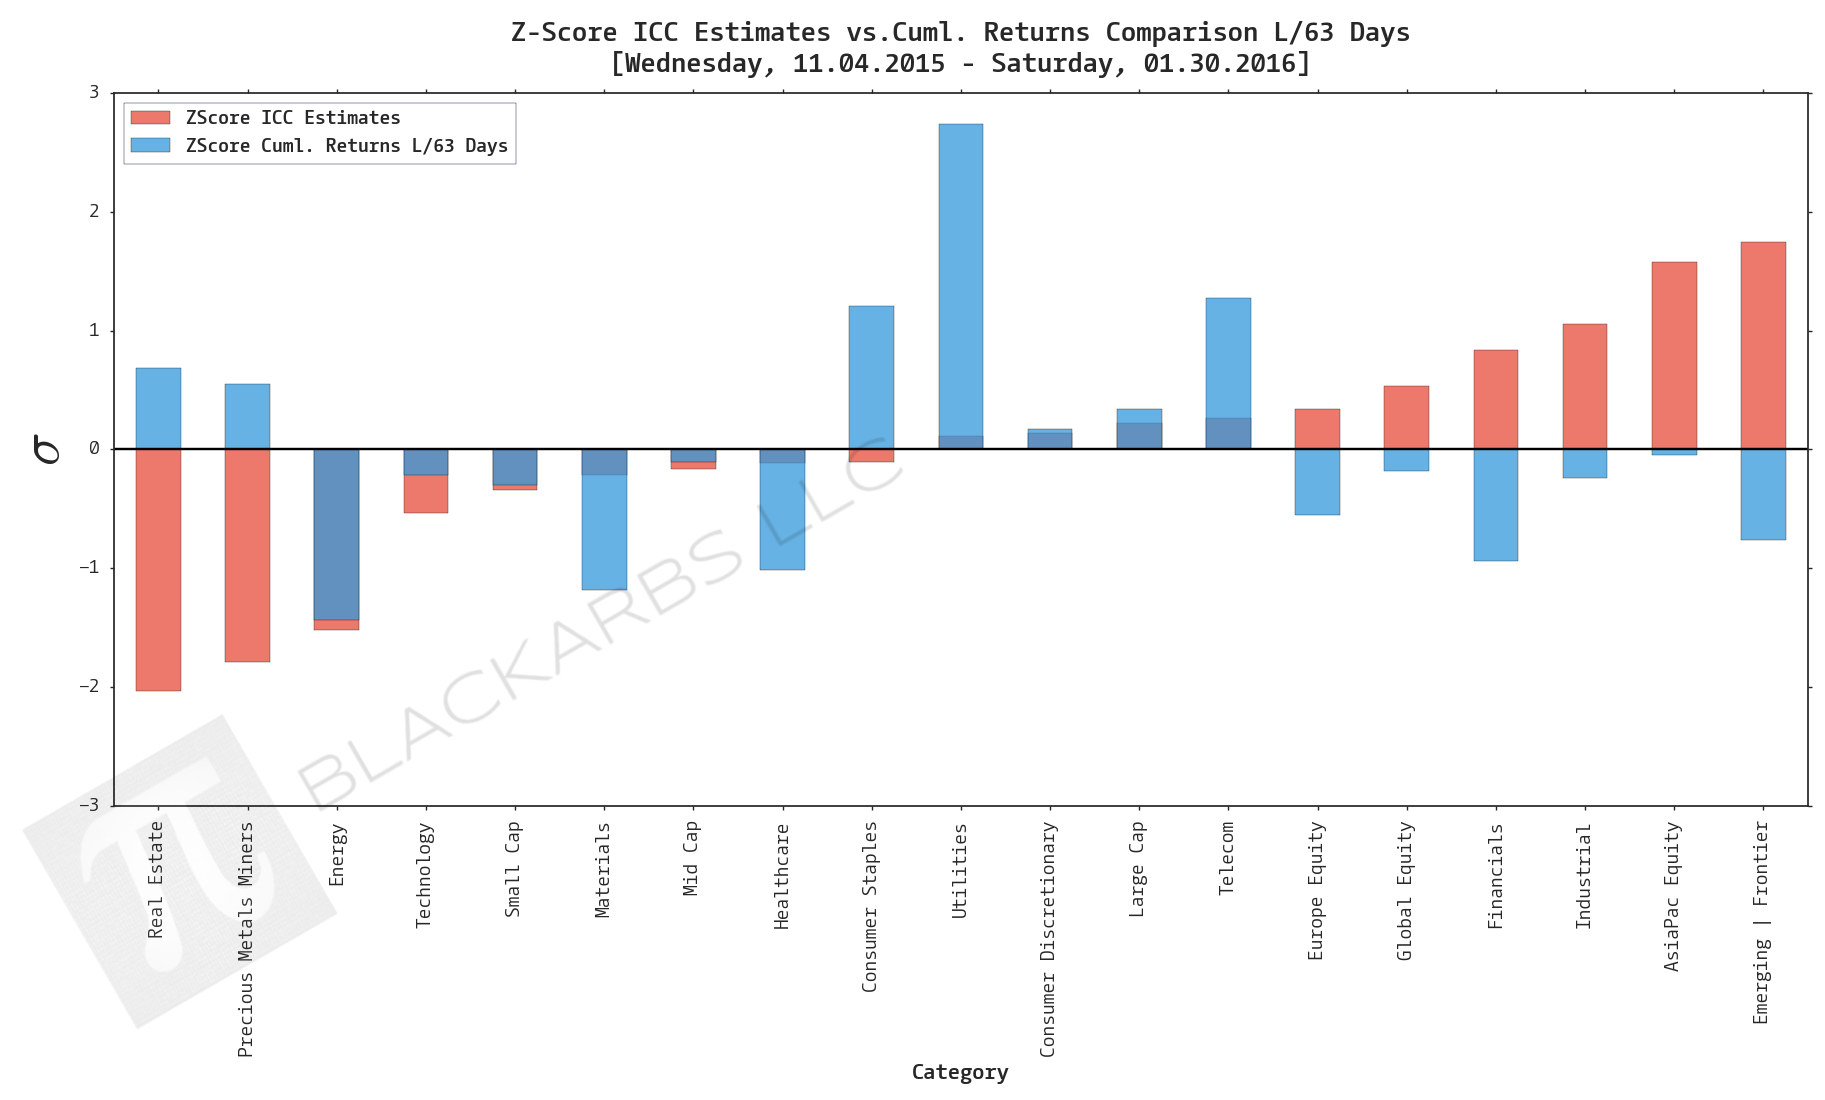
Data Sources: YCharts.com, Yahoo Finance
LAST 21 TRADING DAYS

Data Sources: YCharts.com, Yahoo Finance
LAST 10 TRADING DAYS

Data Sources: YCharts.com, Yahoo Finance
CATEGORY AVERAGE ICC ESTIMATES
Long term growth rate (g) is assumed to be 2.5% reflective of our low growth high debt economic environment.
