

COMPOSITE MACRO ETF WEEKLY ANALYTICS (5/14/2016)
/FOR A DEEPER DIVE INTO ETF PERFORMANCE AND RELATIVE VALUE SUBSCRIBE TO THE ETF INTERNAL ANALYTICS PACKAGE HERE
LAYOUT (Organized by Time Period):
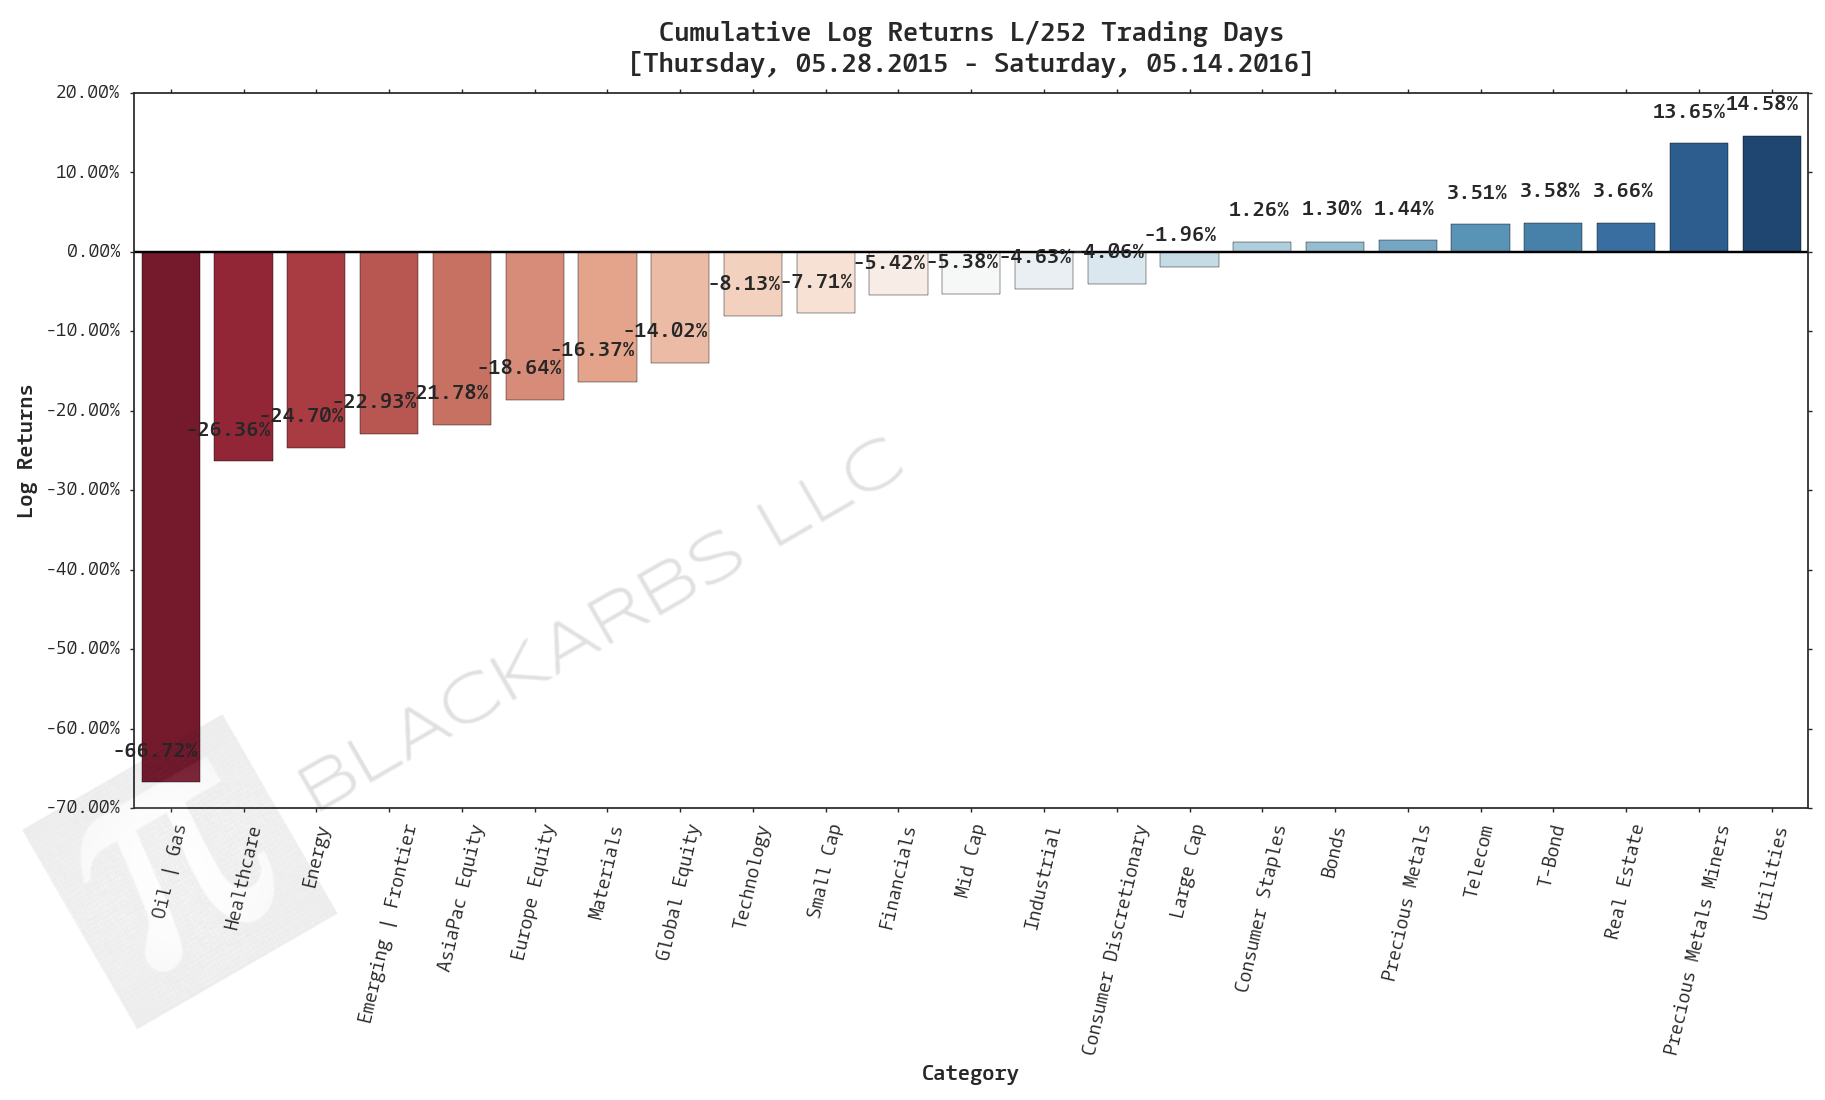
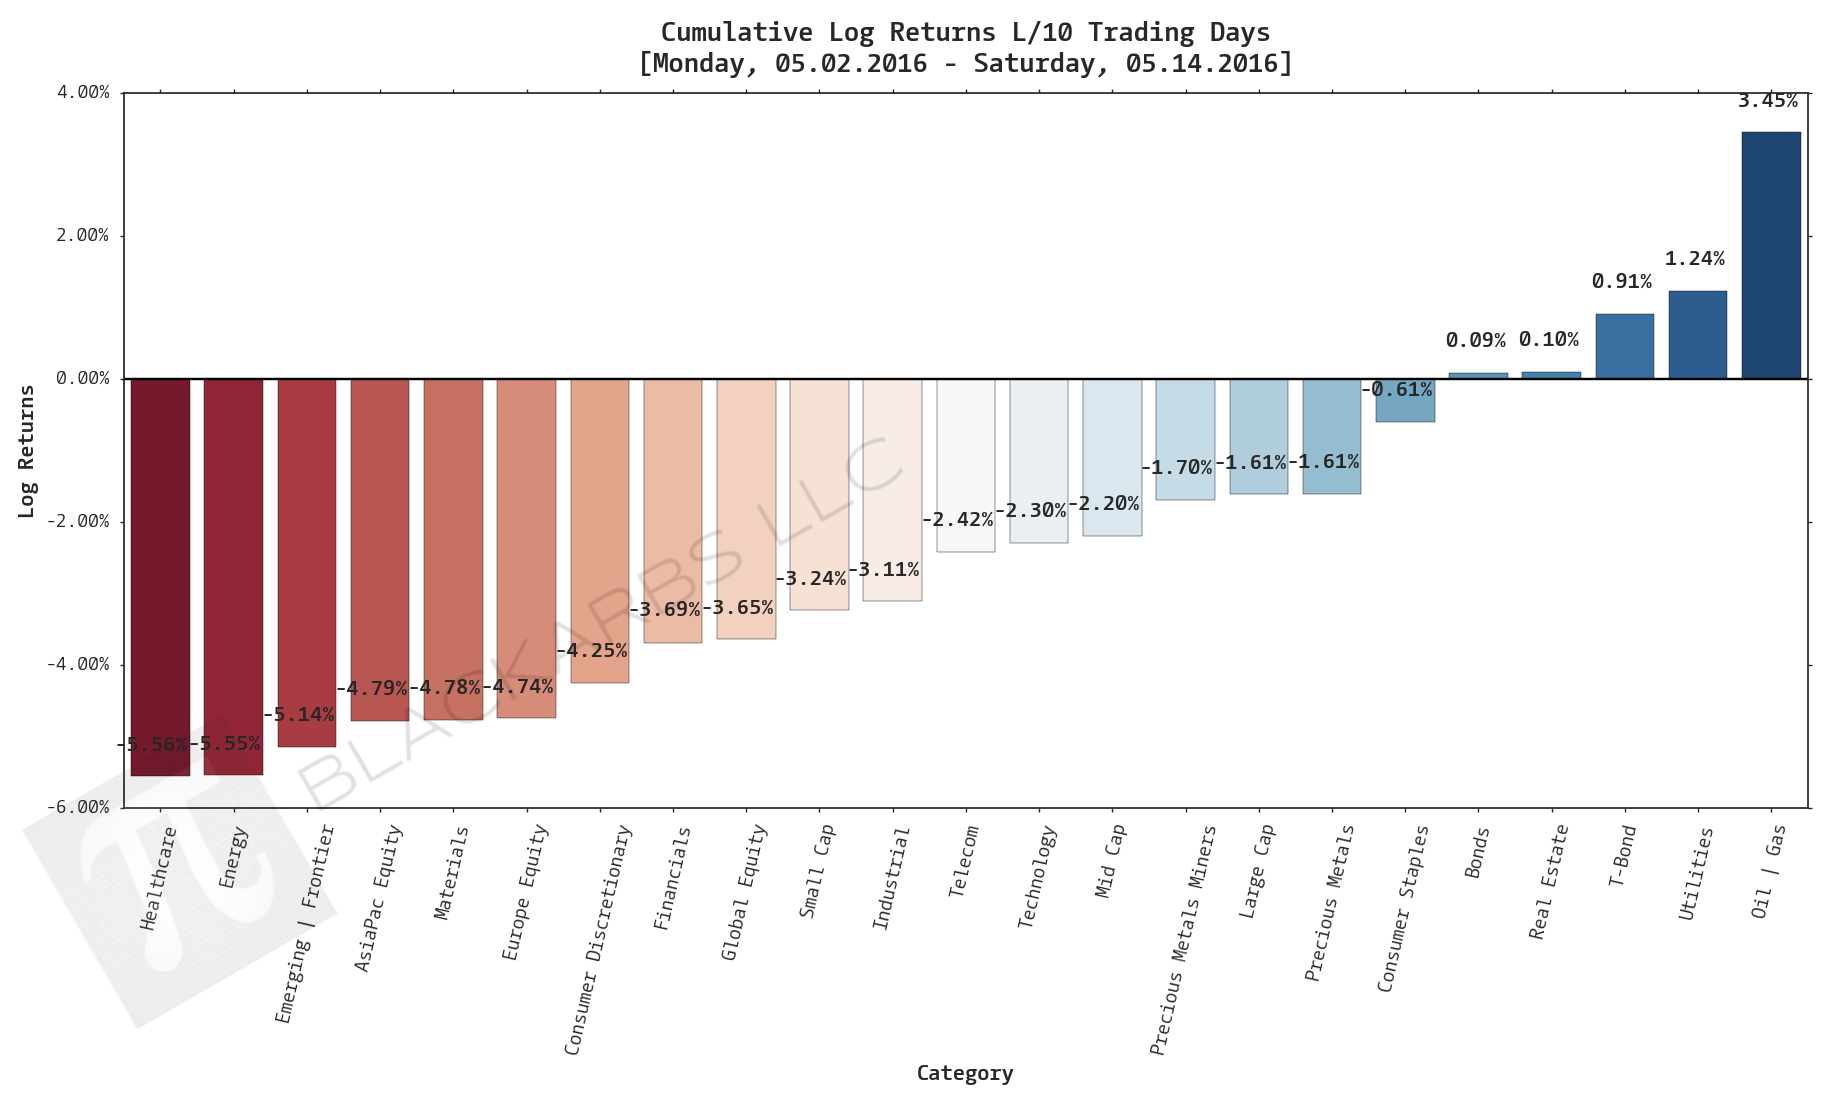
Composite ETF Cumulative Returns Momentum Bar plot
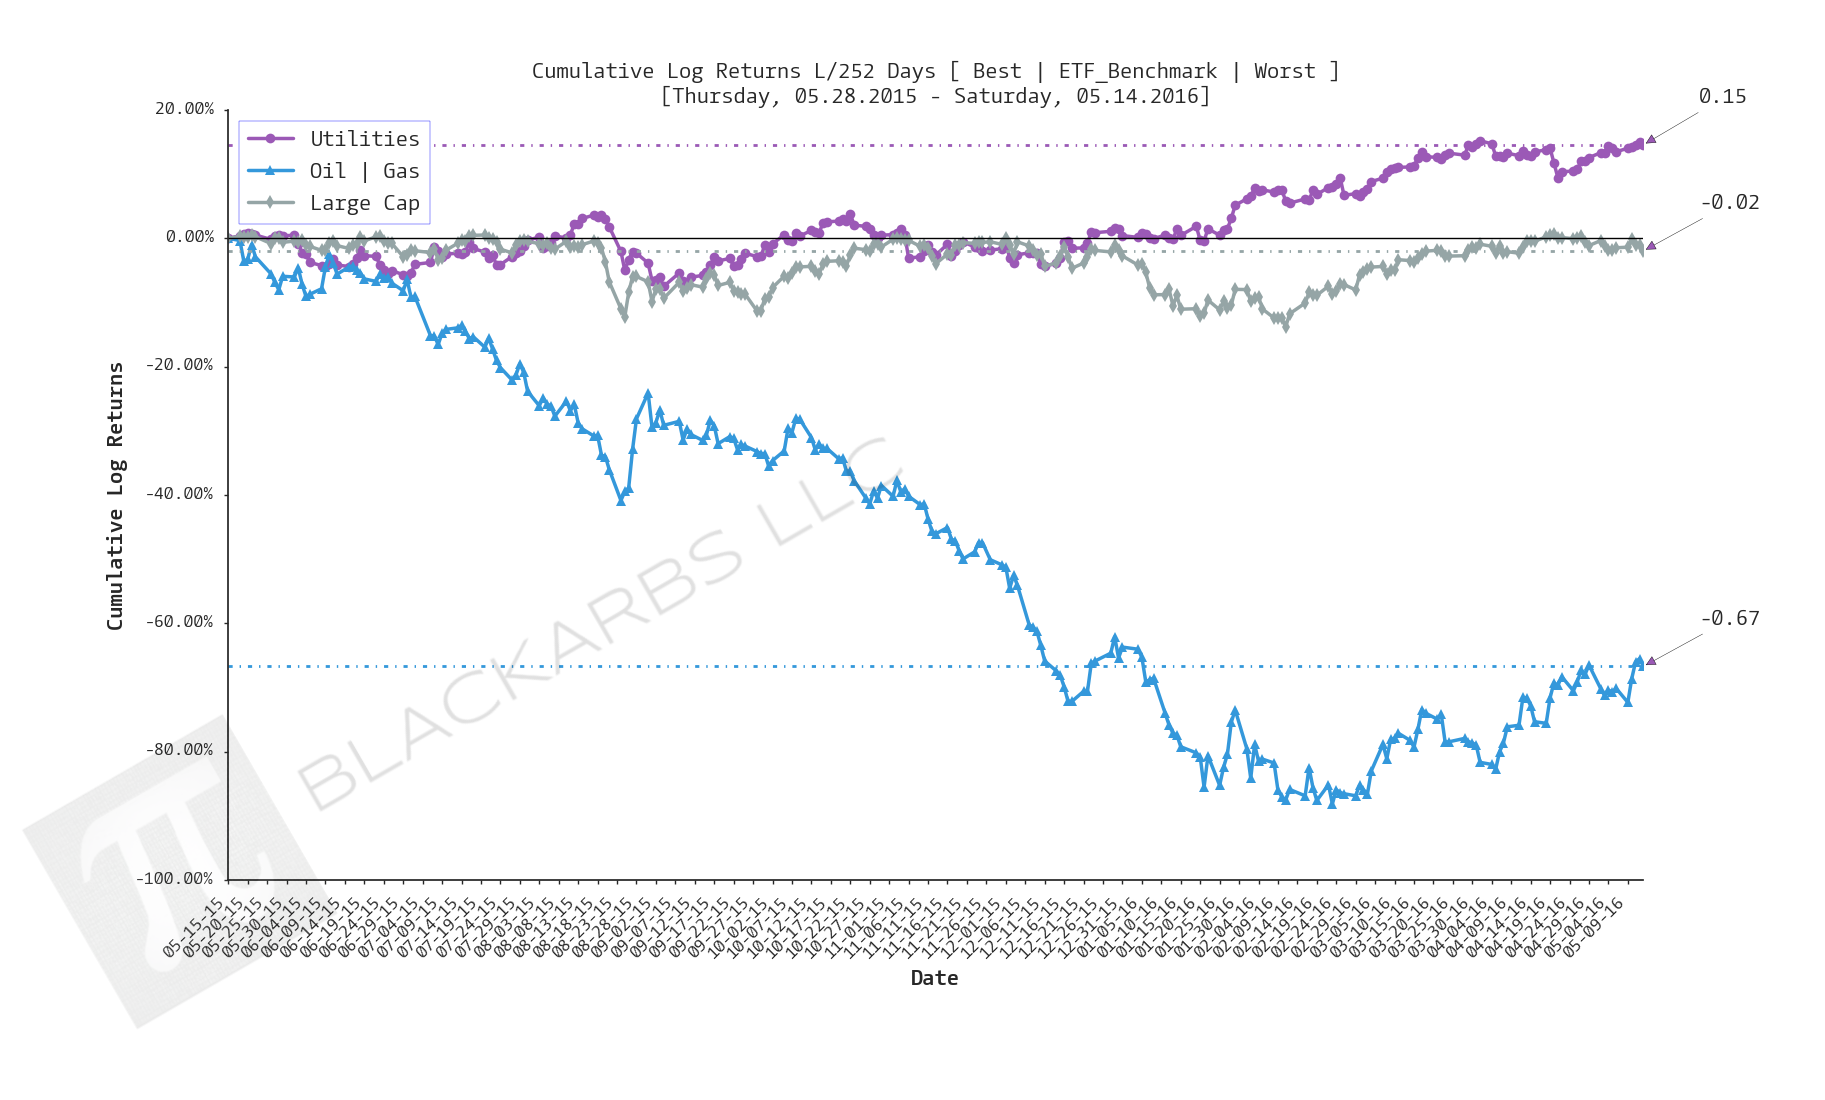
Composite ETF Cumulative Returns Line plot (best vs worst vs benchmark)
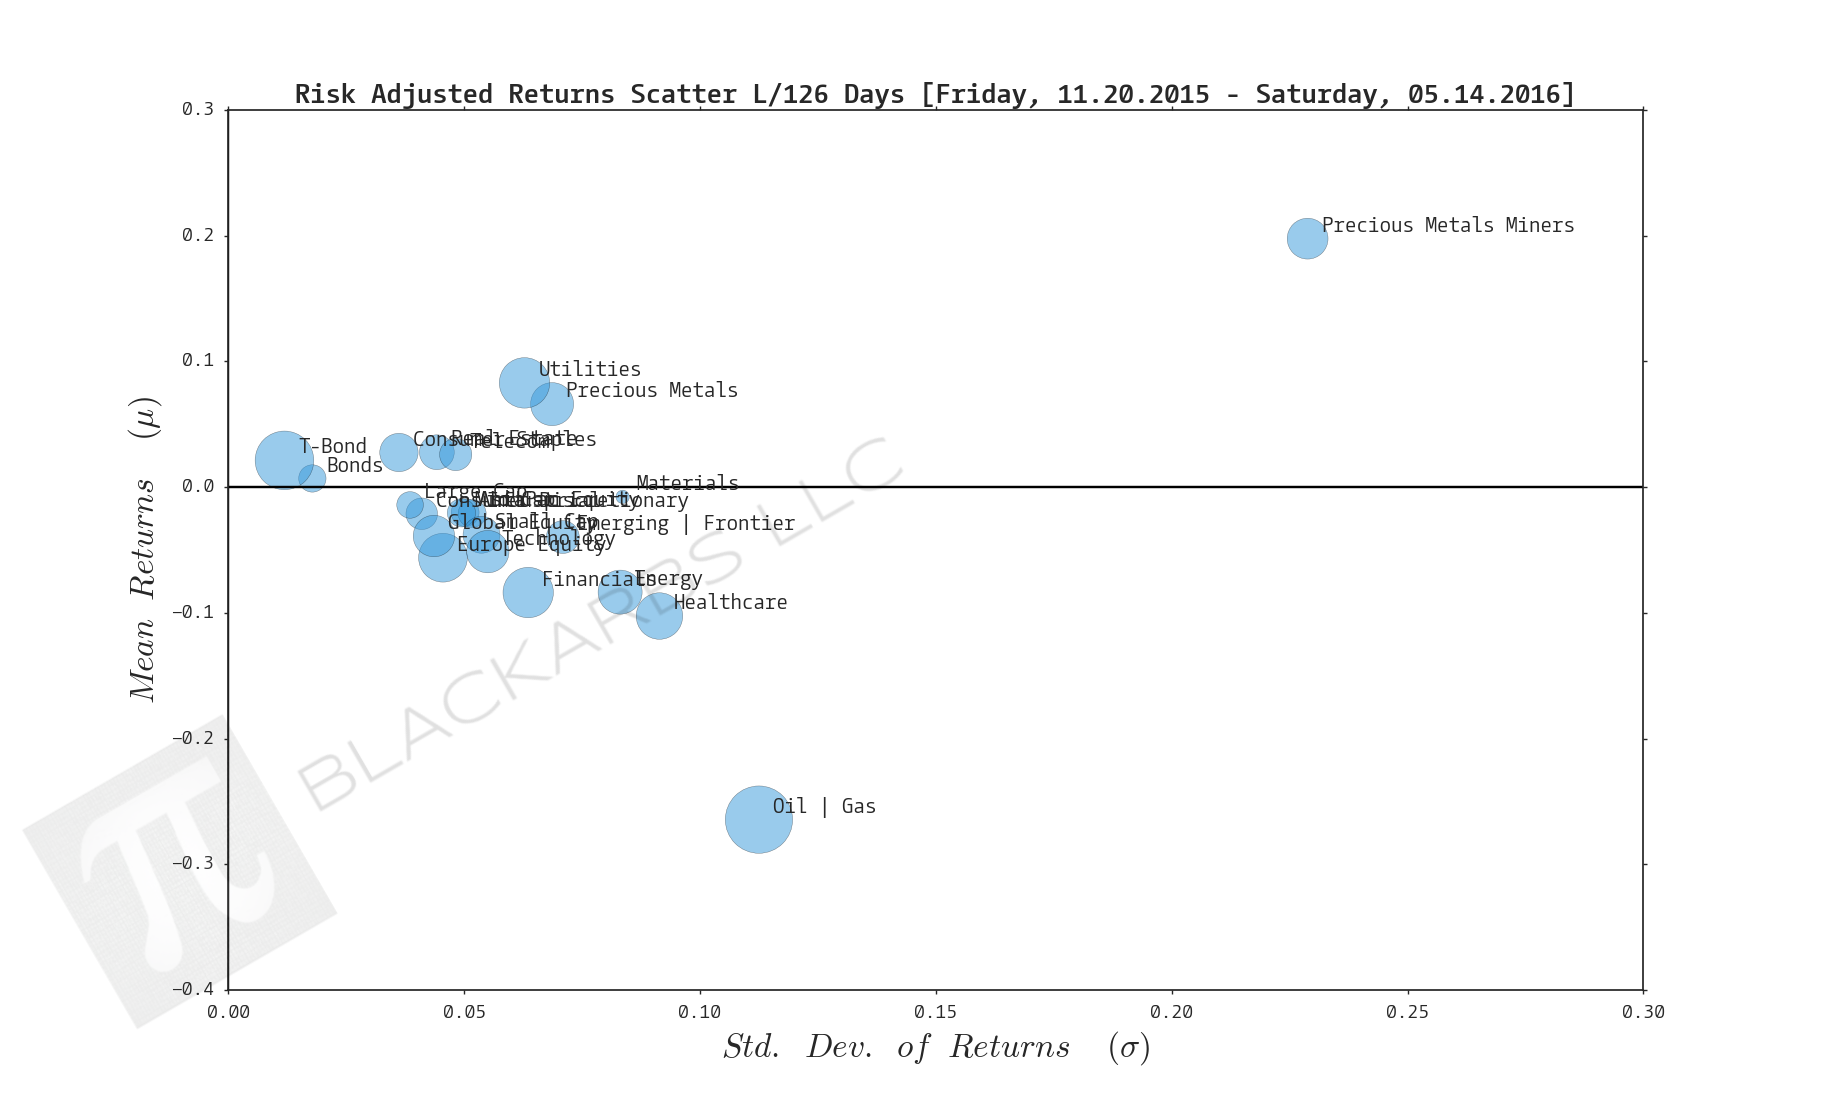
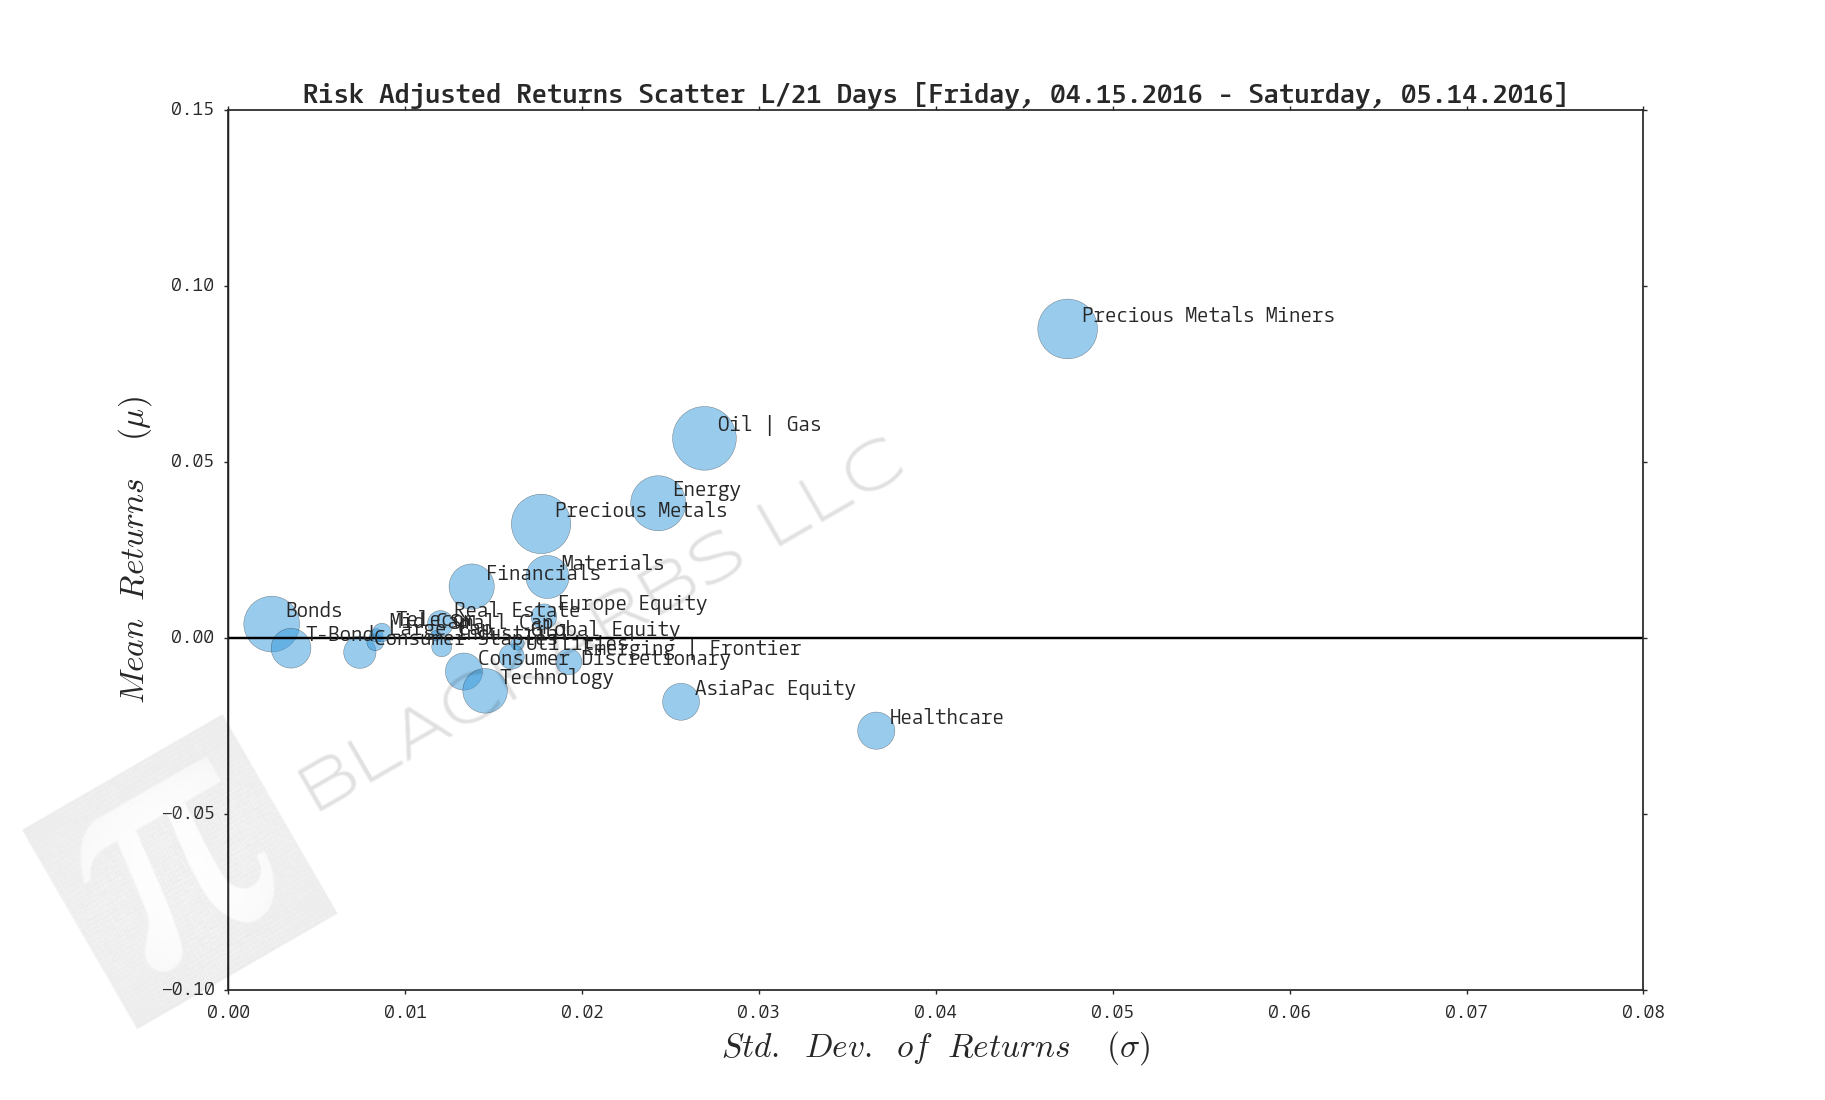
Composite ETF Risk-Adjusted Returns Scatter plot (Std vs Mean)
Composite ETF Risk-Adjusted Return Correlations Heatmap (Clusterplot)
Implied Cost of Capital Estimates
Composite ETF Cumulative Return Tables
Notable Trends and Observations
COMPOSITE ETF COMPONENTS:
LAST 252 TRADING DAYS


LAST 126 TRADING DAYS


LAST 63 TRADING DAYS


LAST 21 TRADING DAYS


LAST 10 TRADING DAYS


Implied Cost of Capital Estimates:
To learn more about the Implied Cost of Capital see here.
ALL ETF ICC ESTIMATES BY CATEGORY
CATEGORY AVERAGE ICC ESTIMATES
CUMULATIVE RETURN TABLES:
NOTABLE OBSERVATIONS AND TRENDS:
- The healthcare composite has been a bottom 3 performer across all time frames.
- The Oil+Gas composite has been strong recently as a top 3 performer L/63, L/21, and L/10 days.
- The Large Cap composite is essentially unchanged over the L/252 and L/126 days.
- PMM has continued to outperform. The long gold and gold producers trade has been the trade of the year.
- PMM is up 60% (log returns) over L/126 days!
- An anecdotal observation: When every composite is all positive(negative) returns over the L/63 days or less, there has been a tendency for the markets to mean revert. Notice the return range compression for both best/worst performers over L/10 days. Seems like there is either a lack of catalysts or indecision among market participants.
