

COMPOSITE MACRO ETF WEEKLY ANALYTICS (1/23/2016)
/LAYOUT (Organized by Time Period):
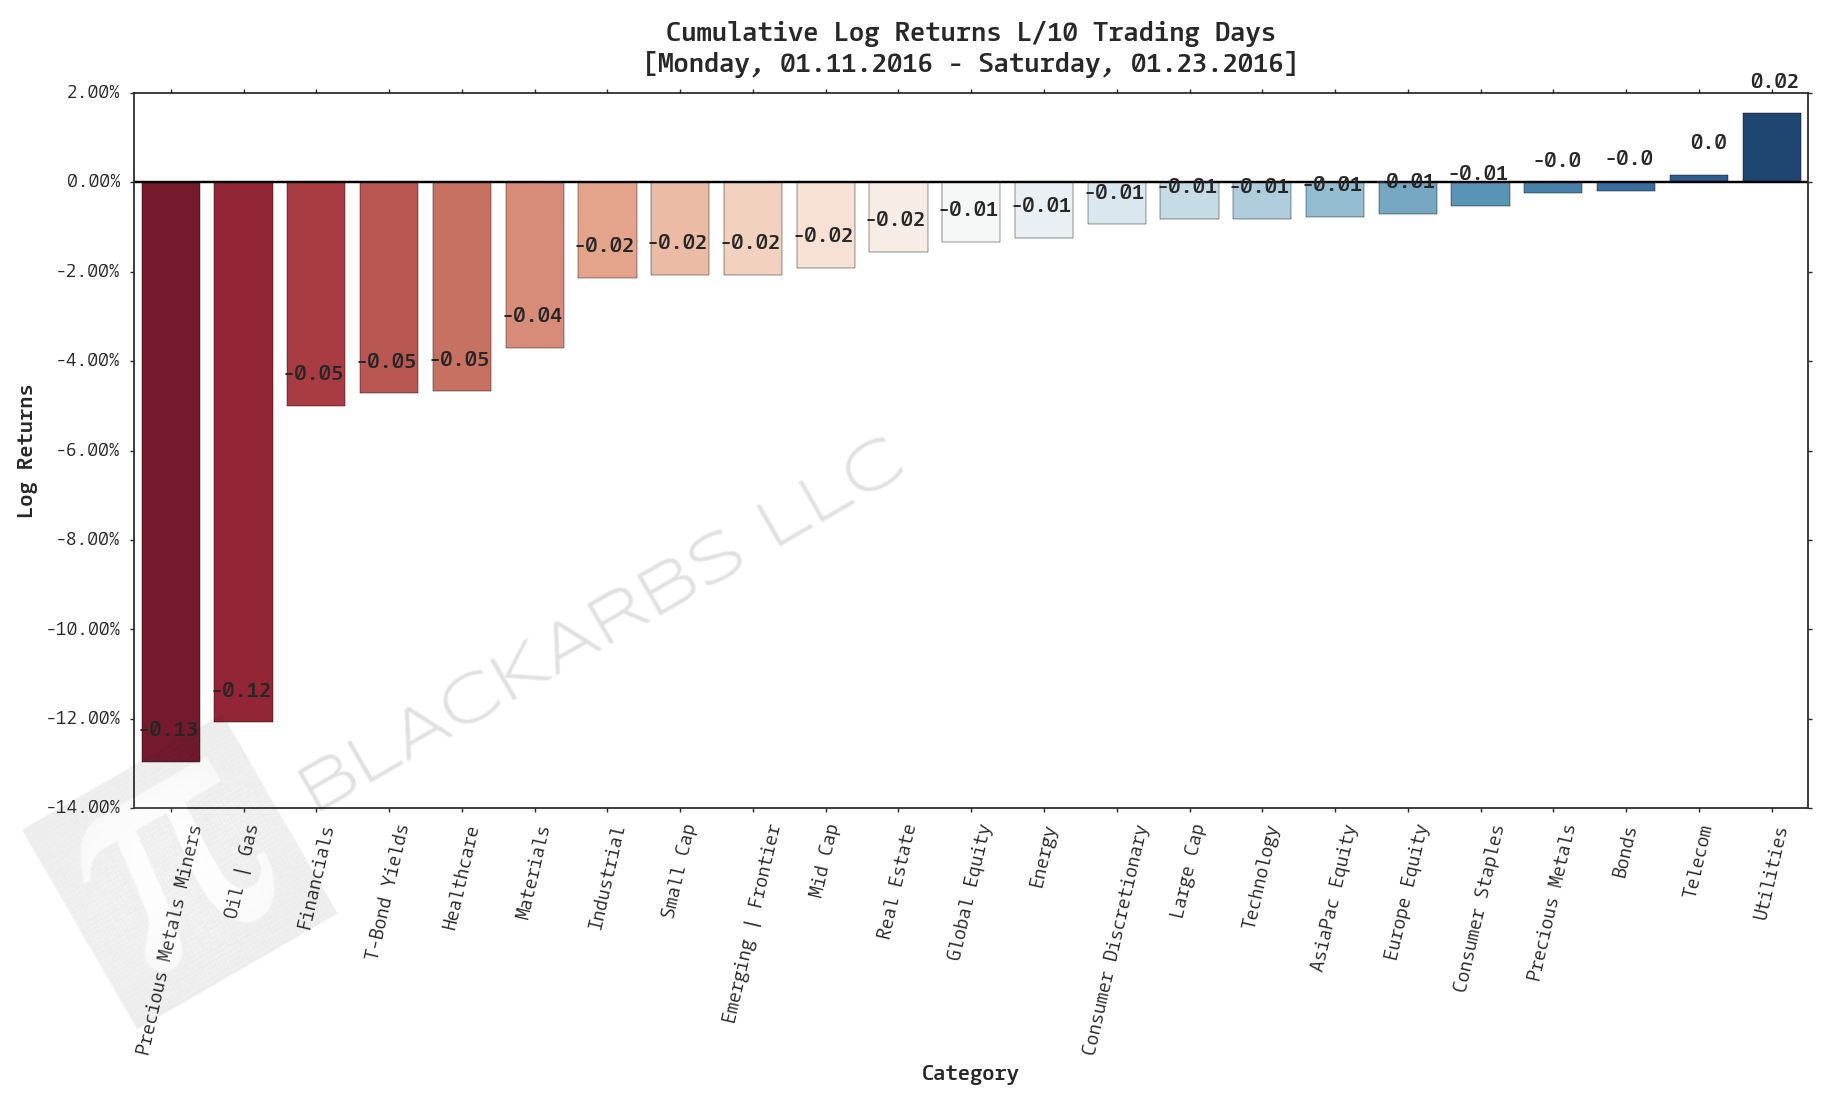
Composite ETF Cumulative Returns Momentum Bar plot
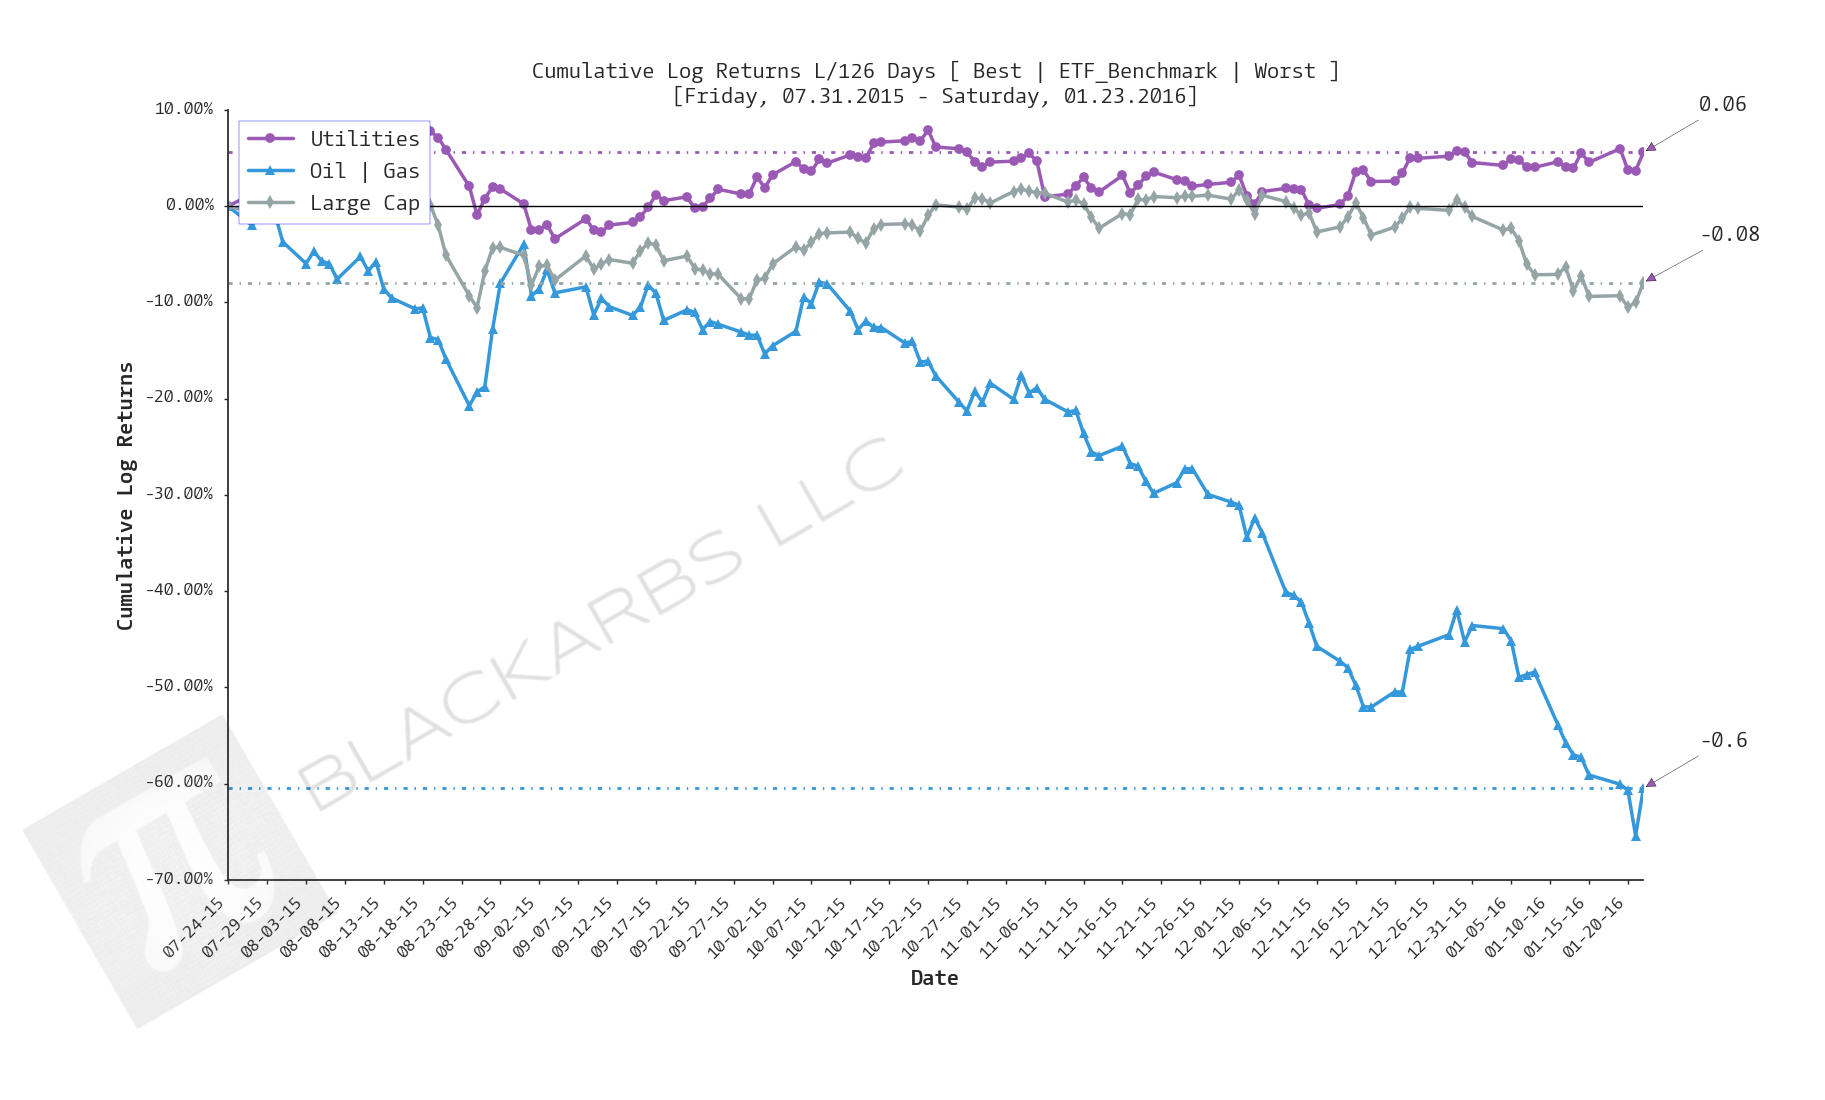
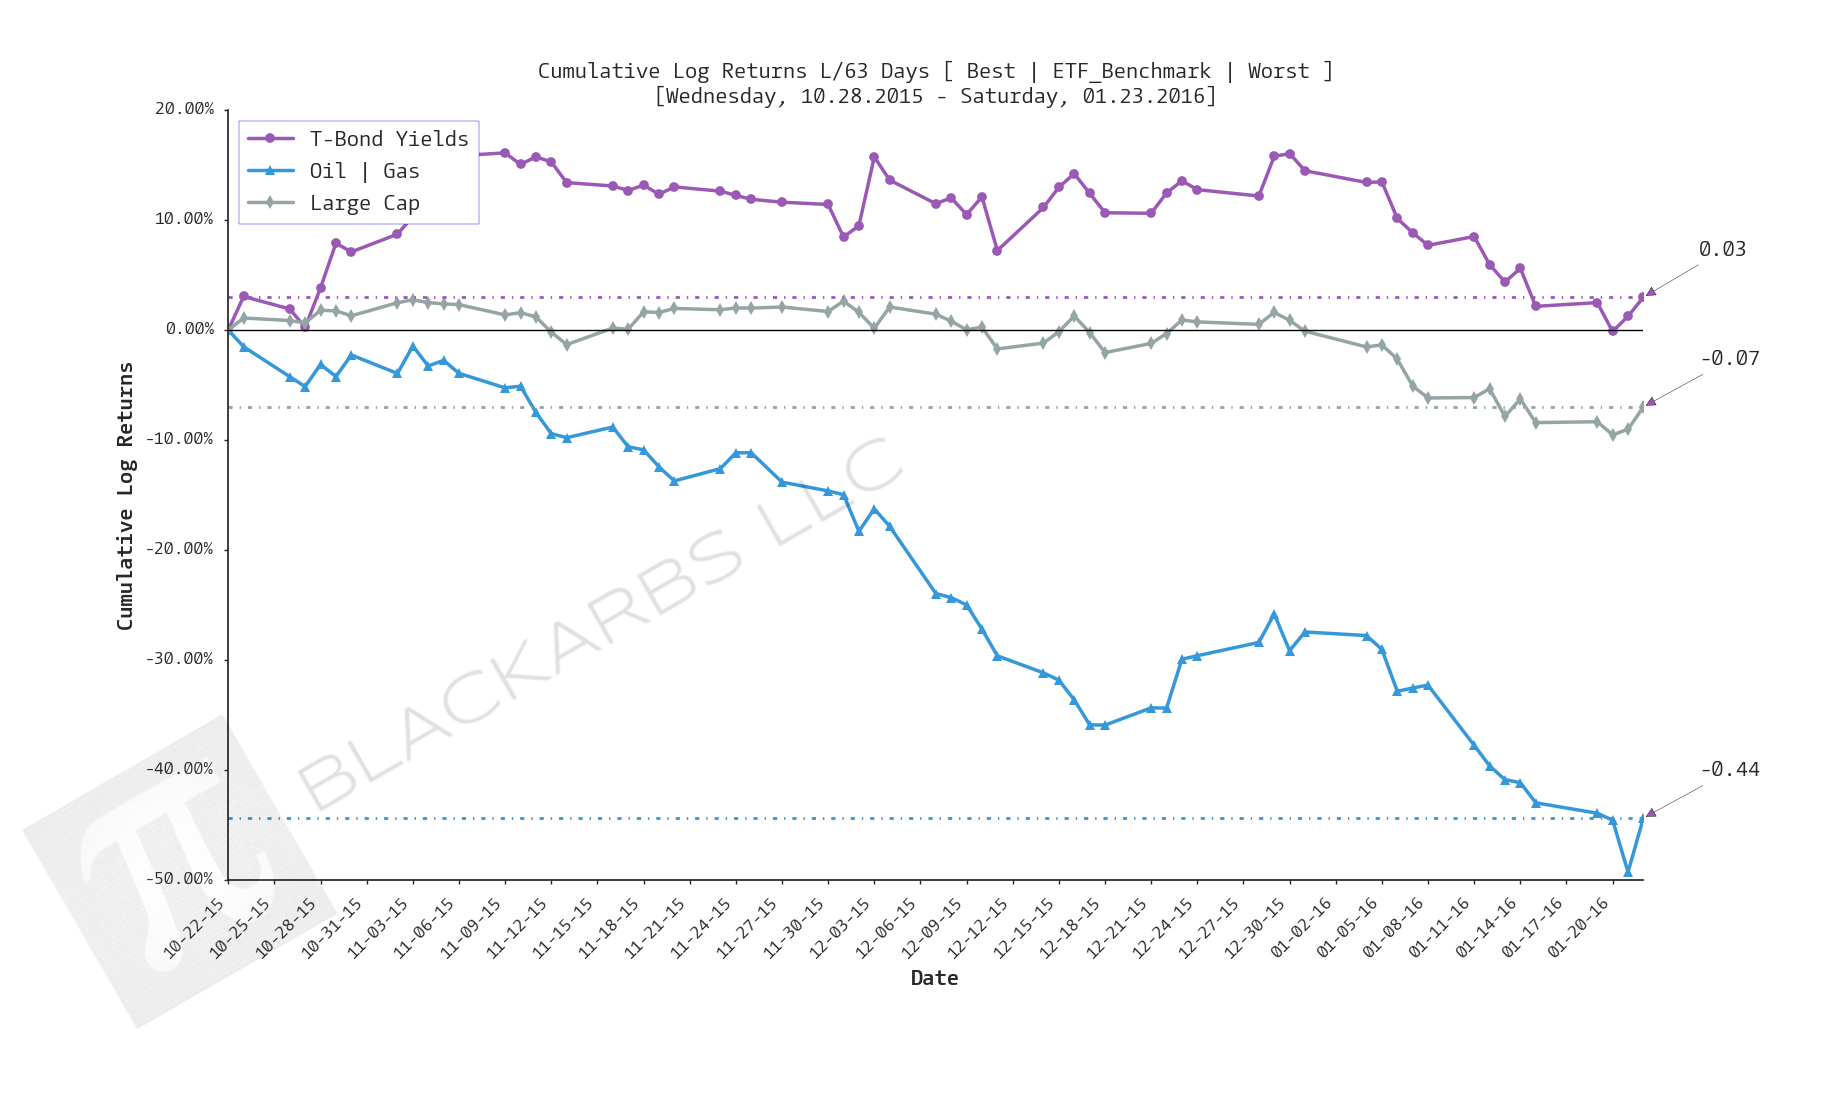
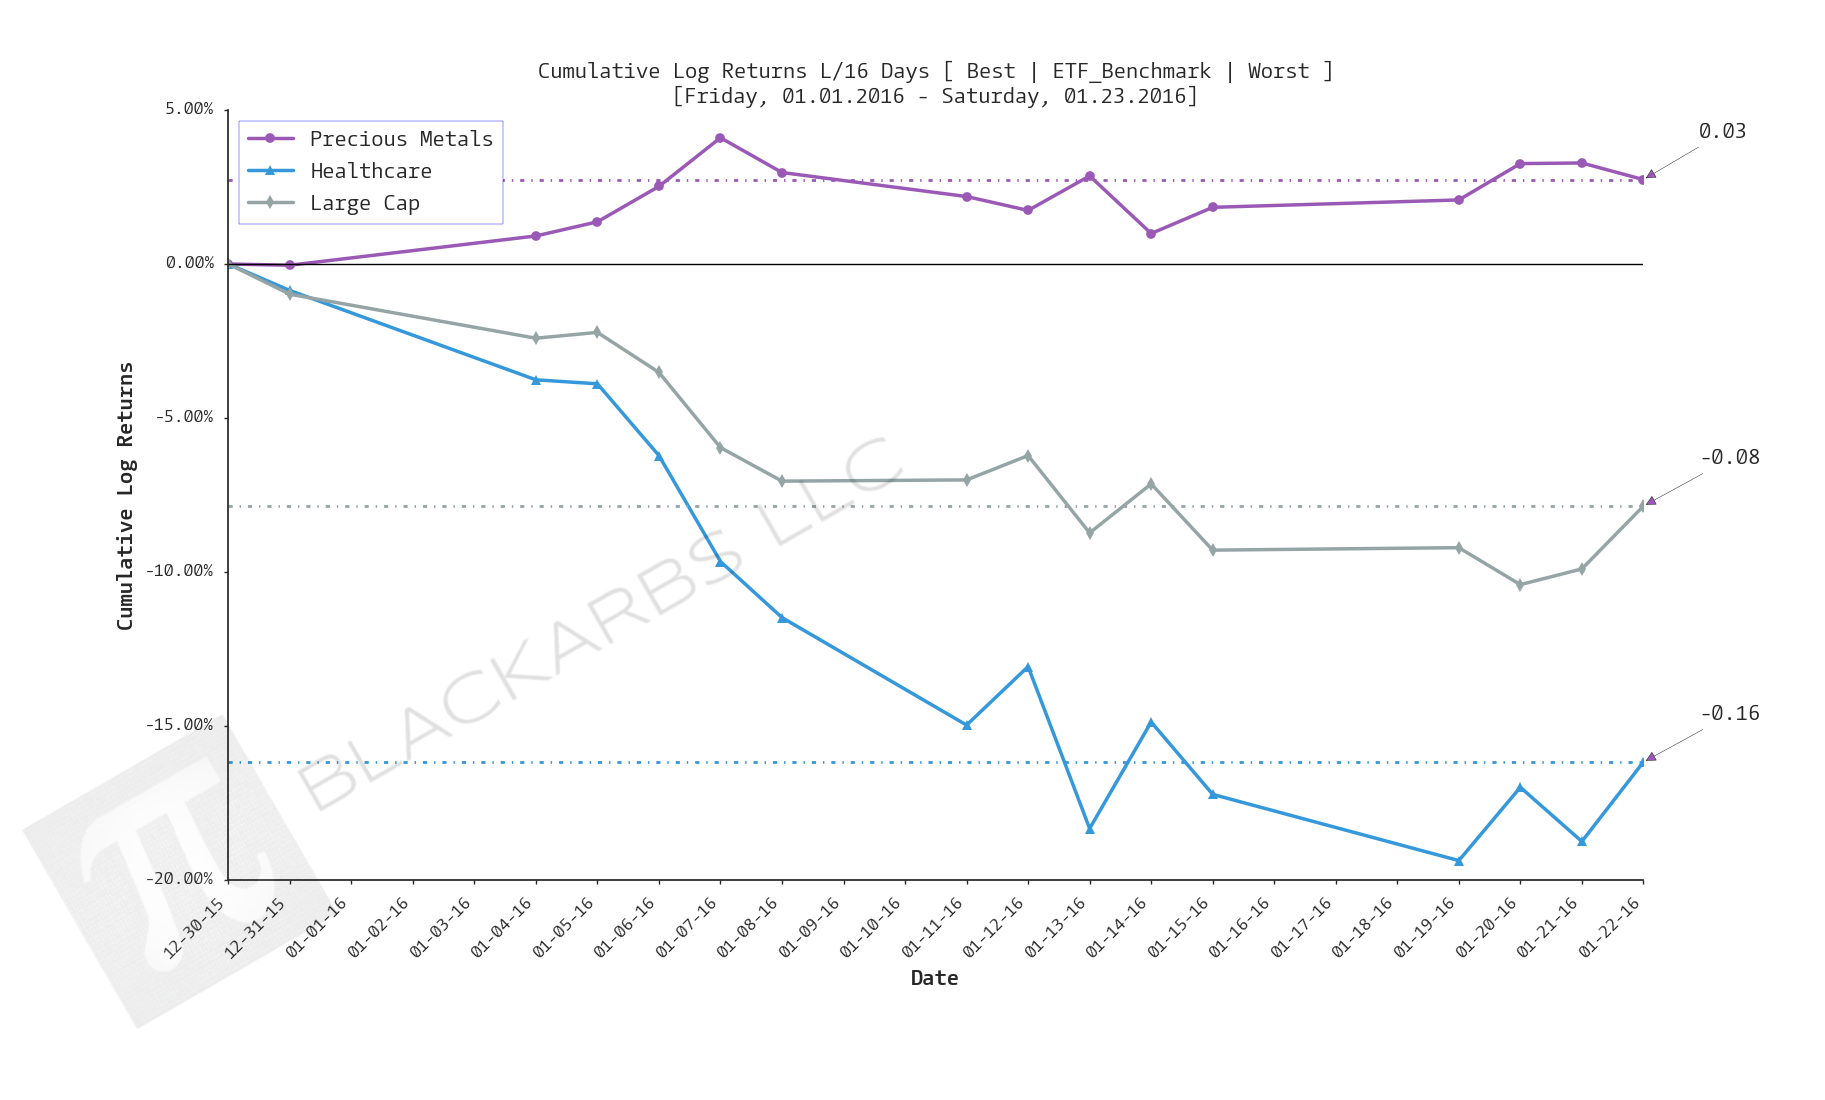
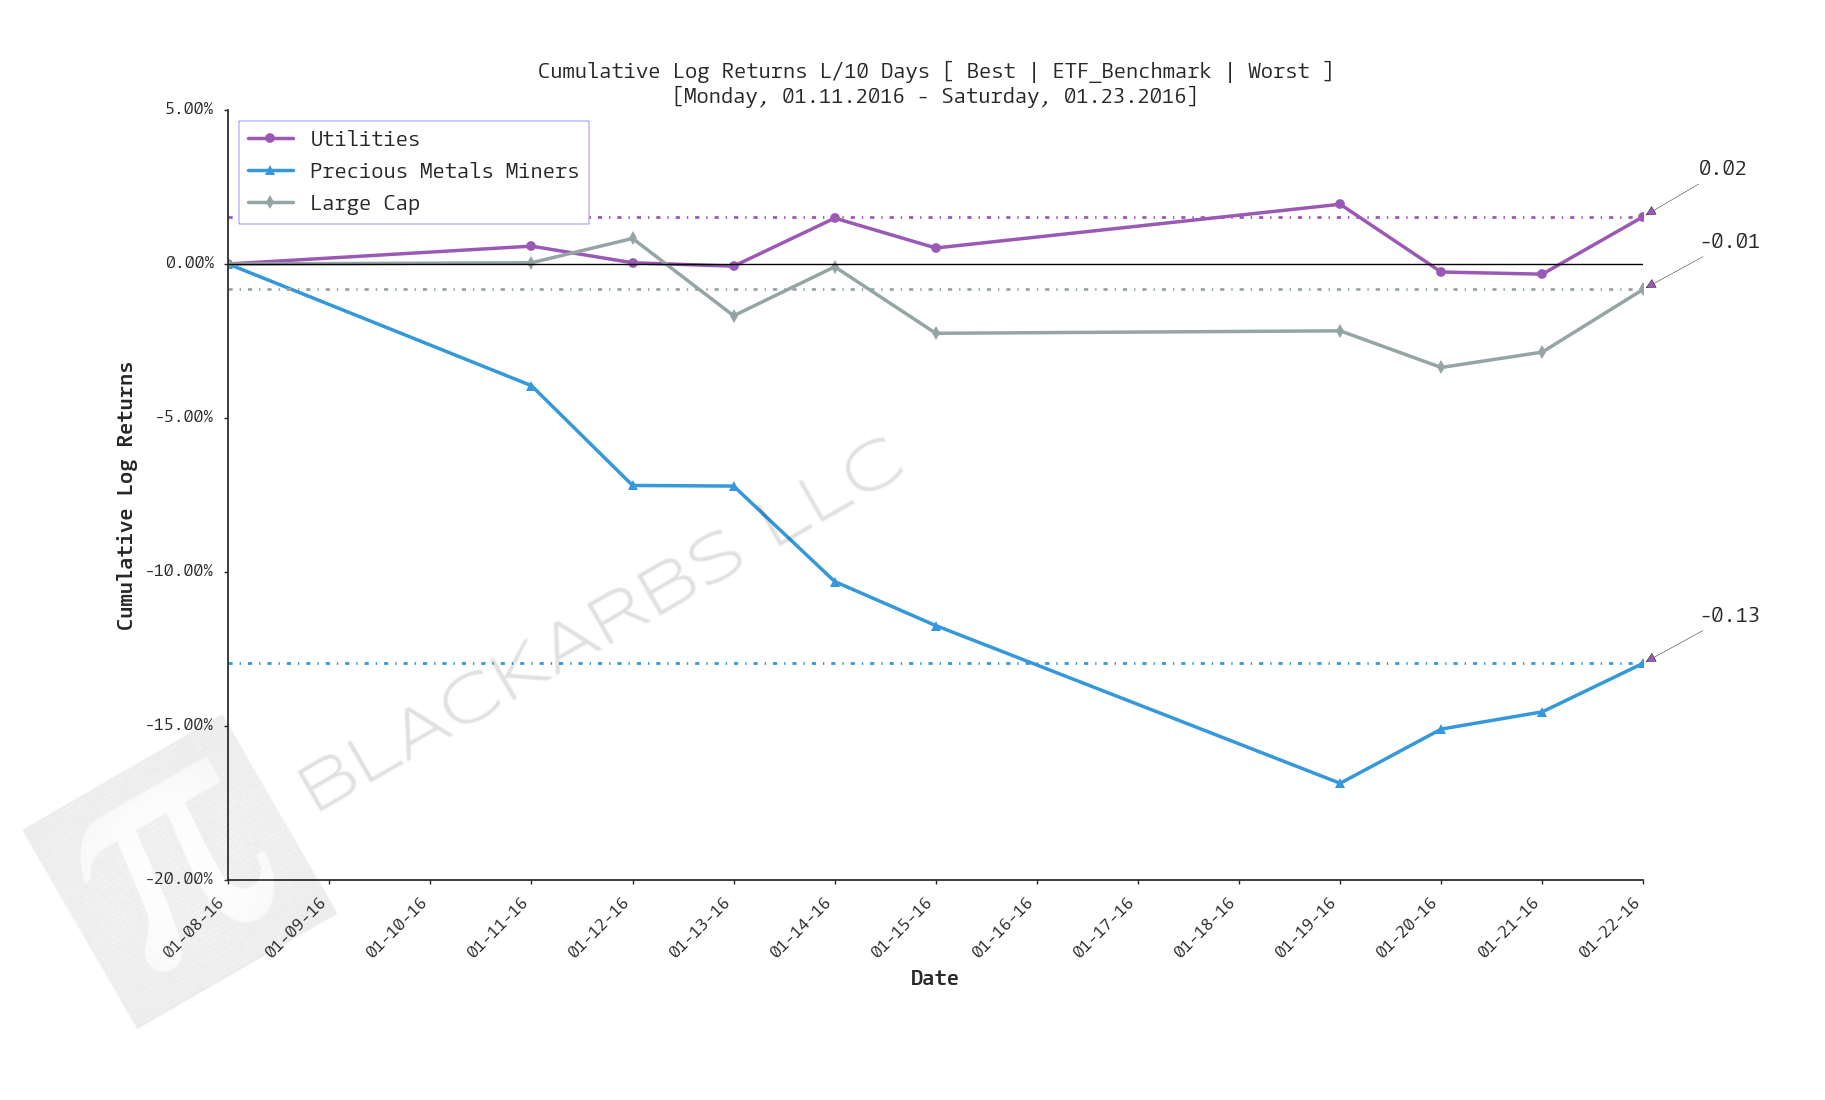
Composite ETF Cumulative Returns Line plot
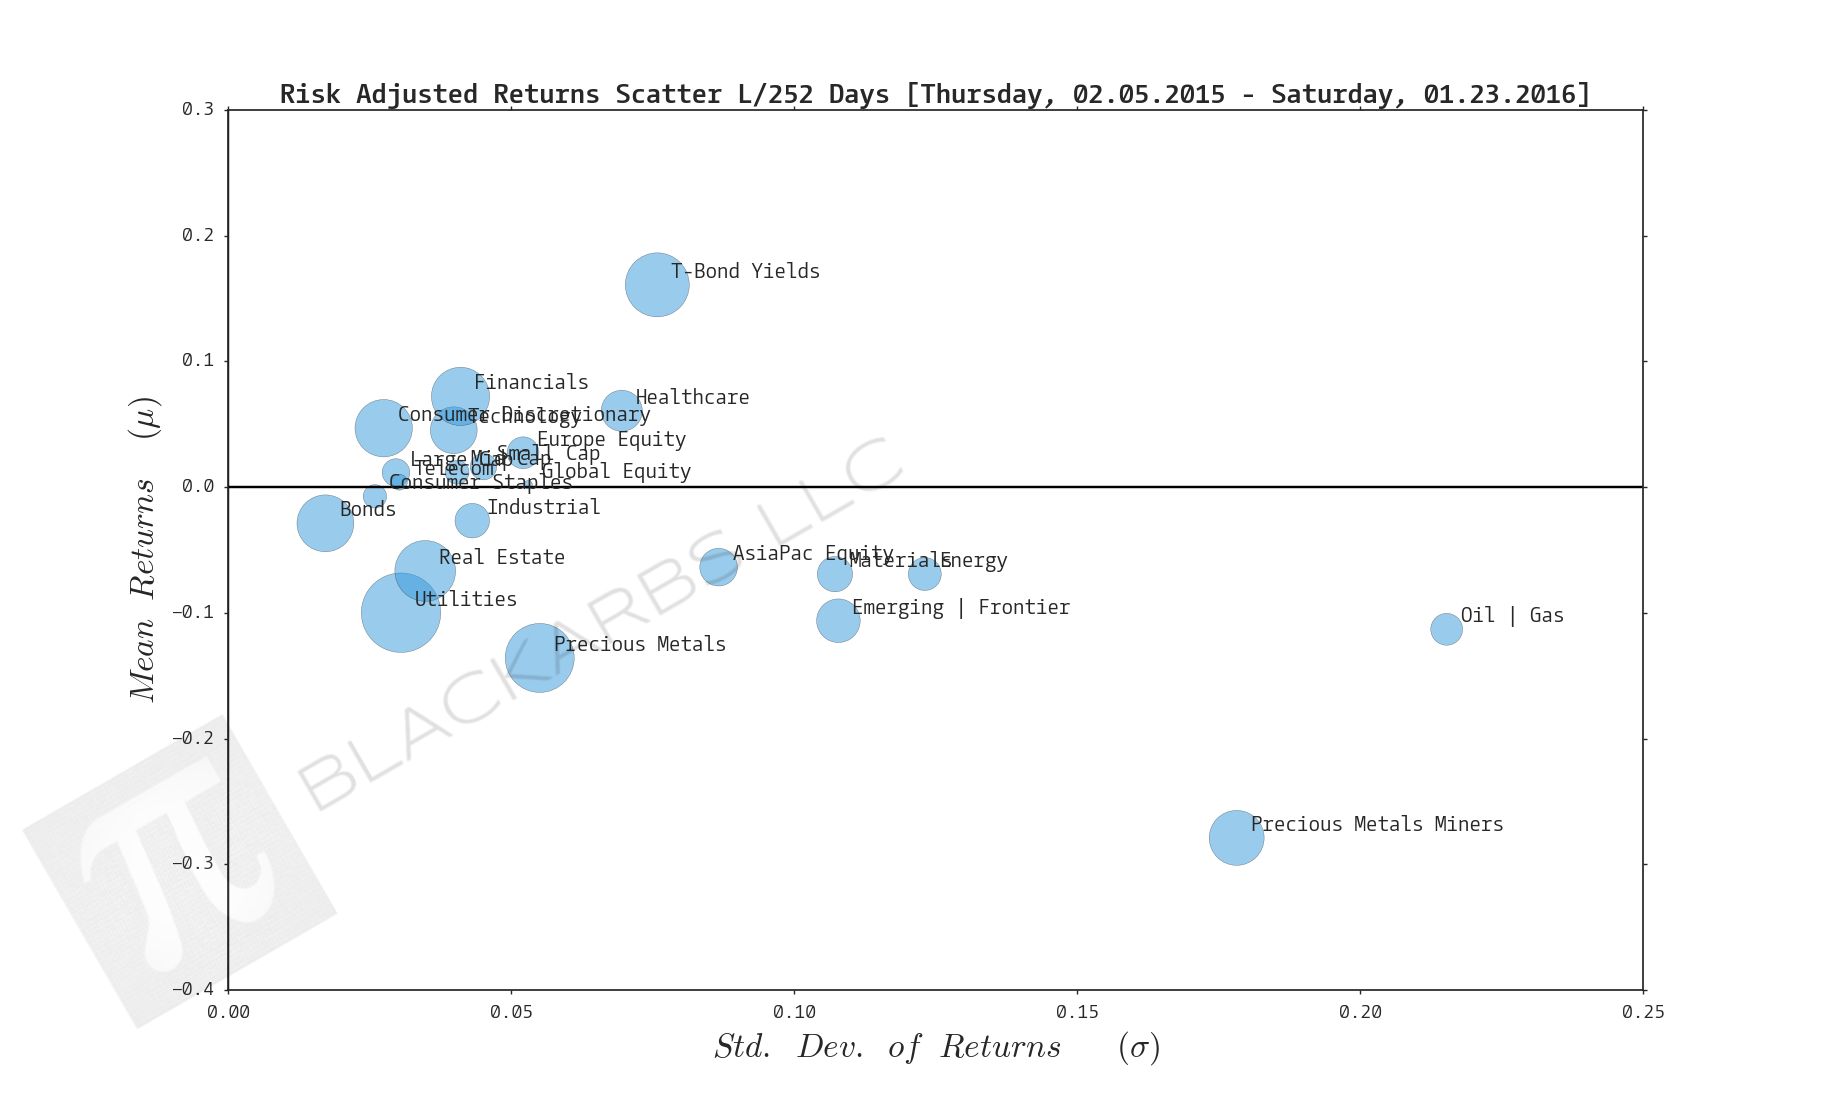
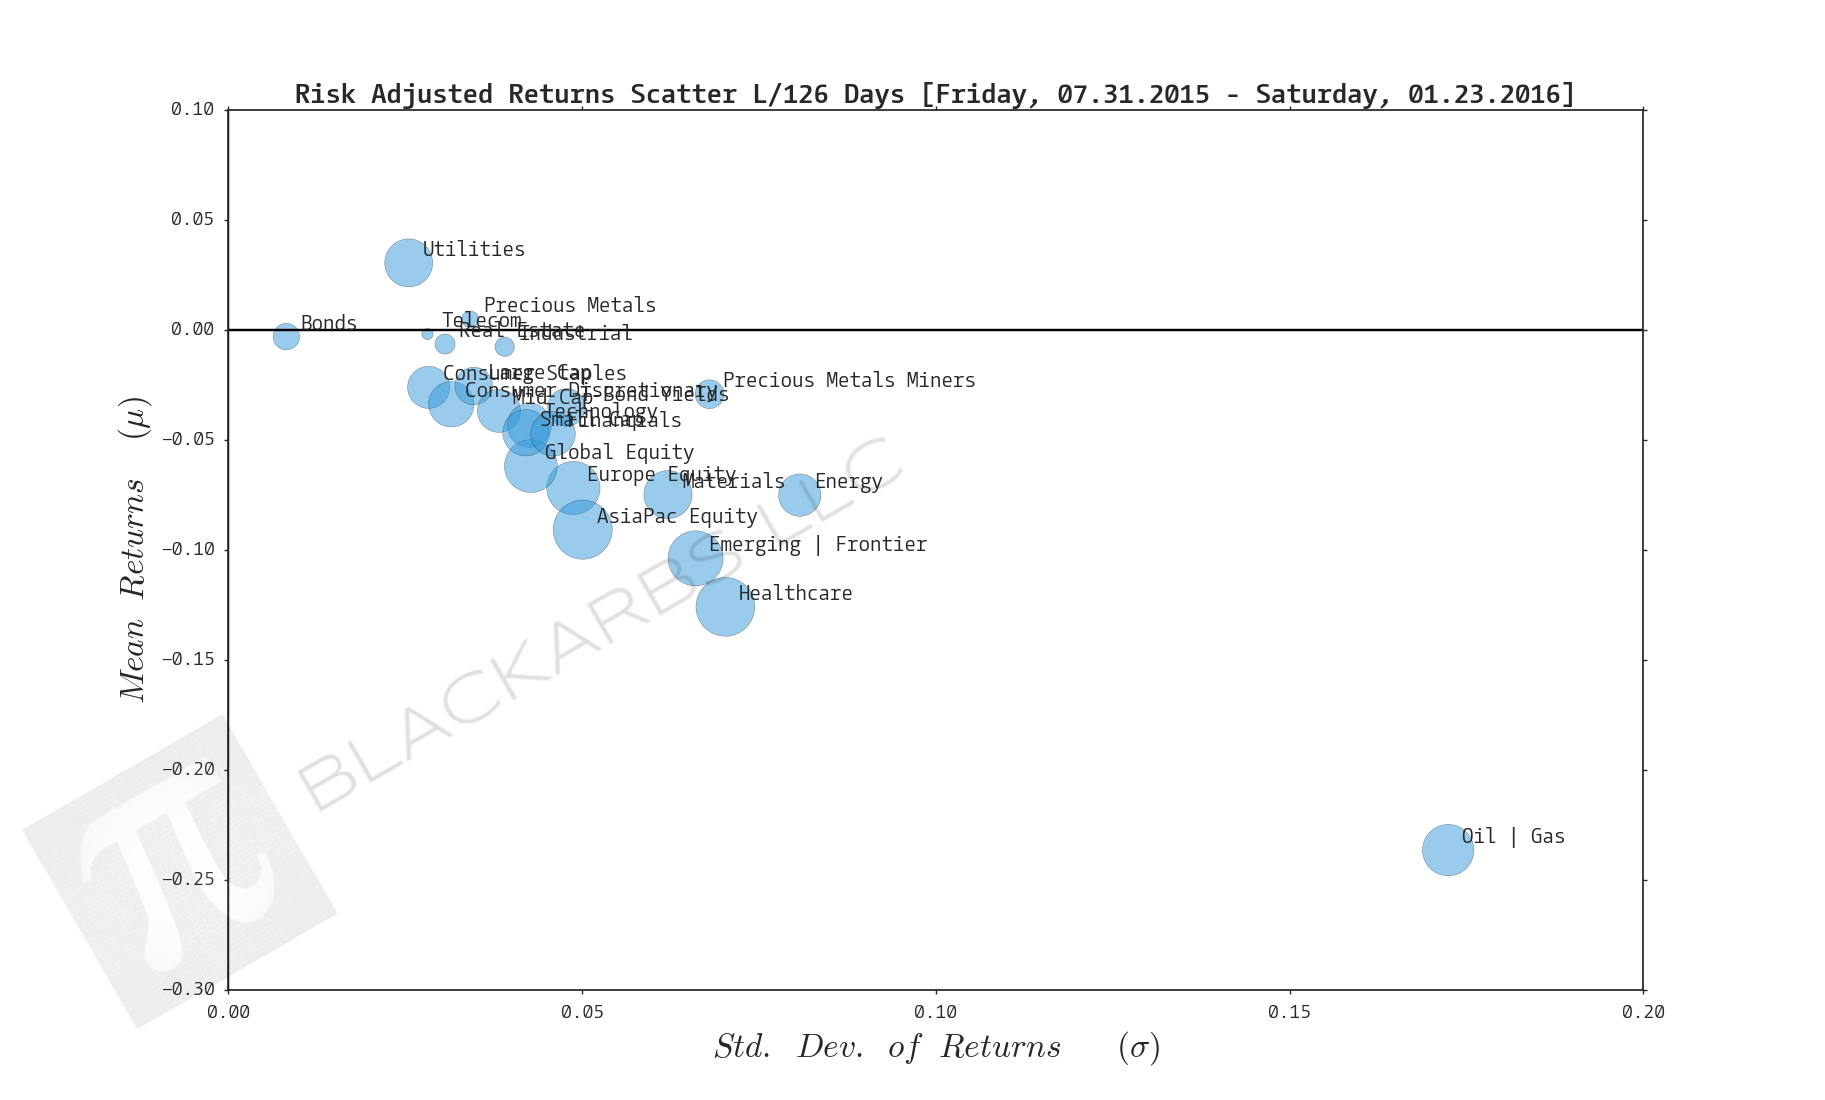
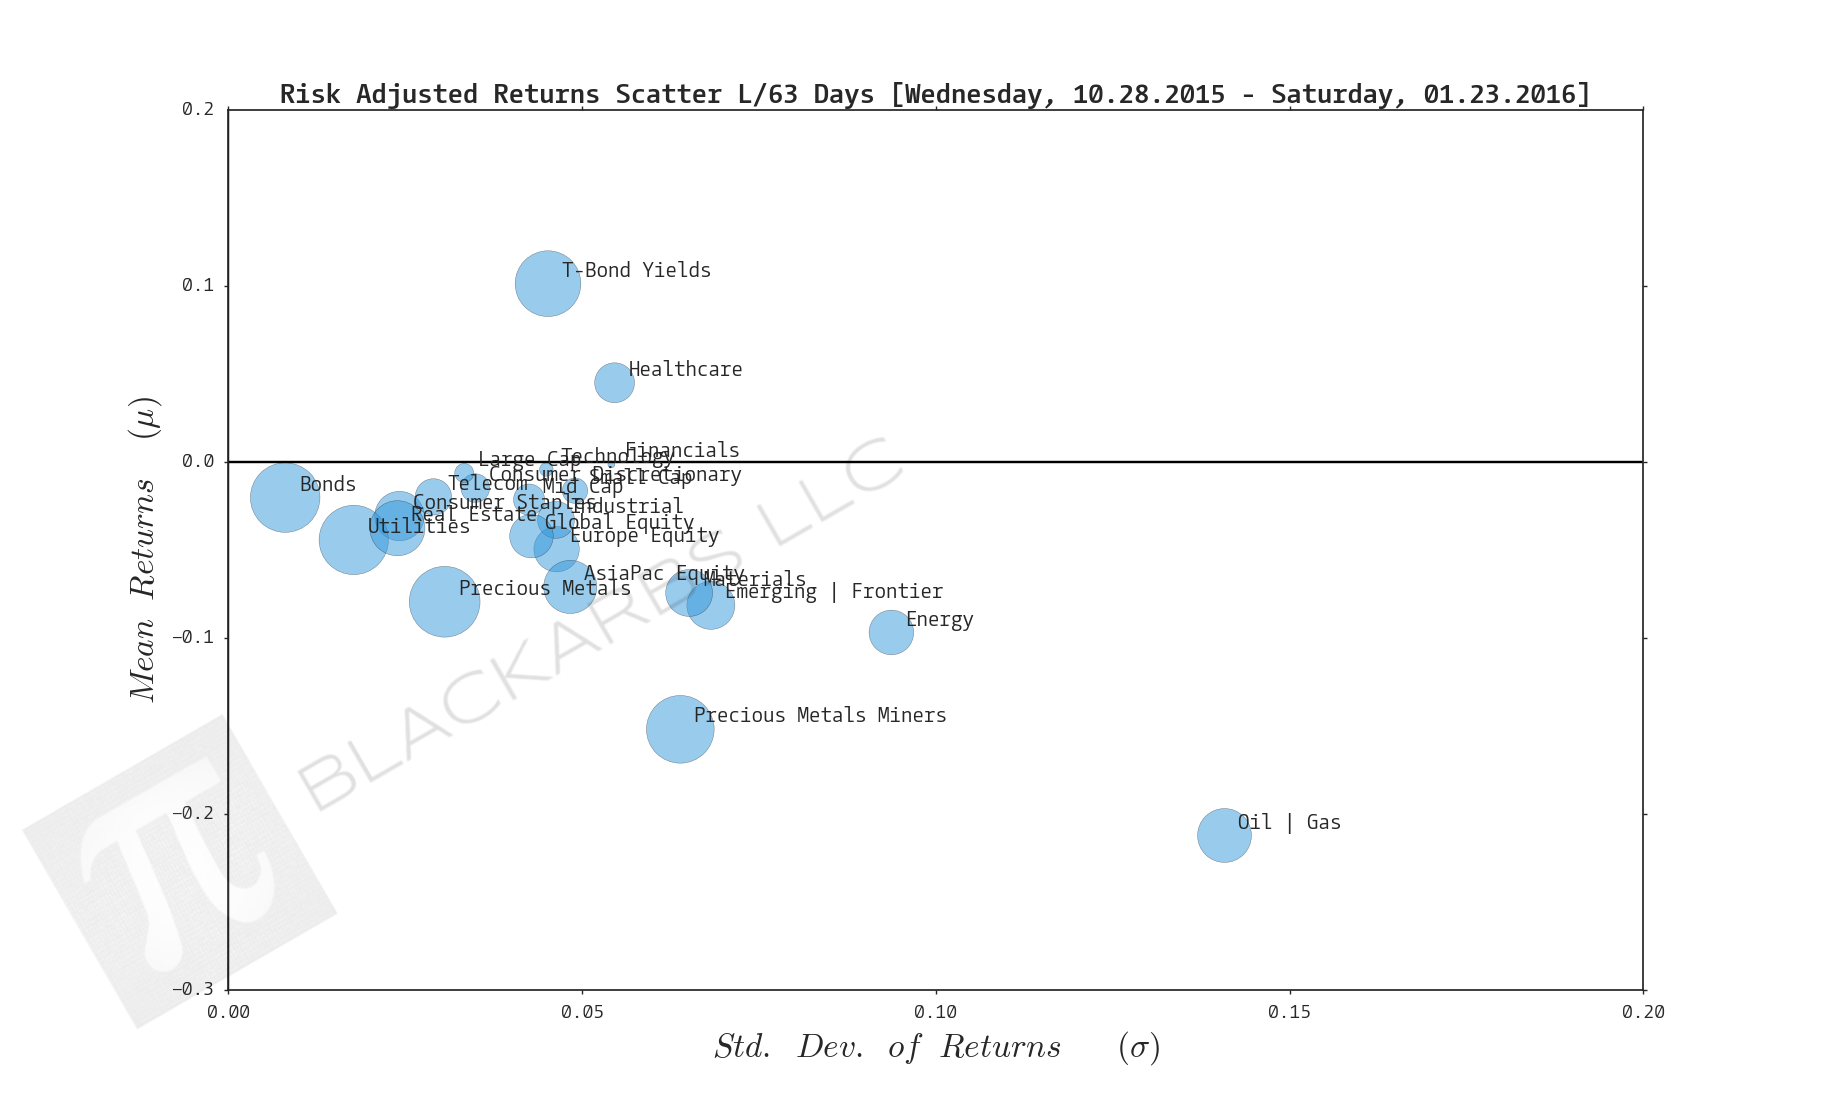
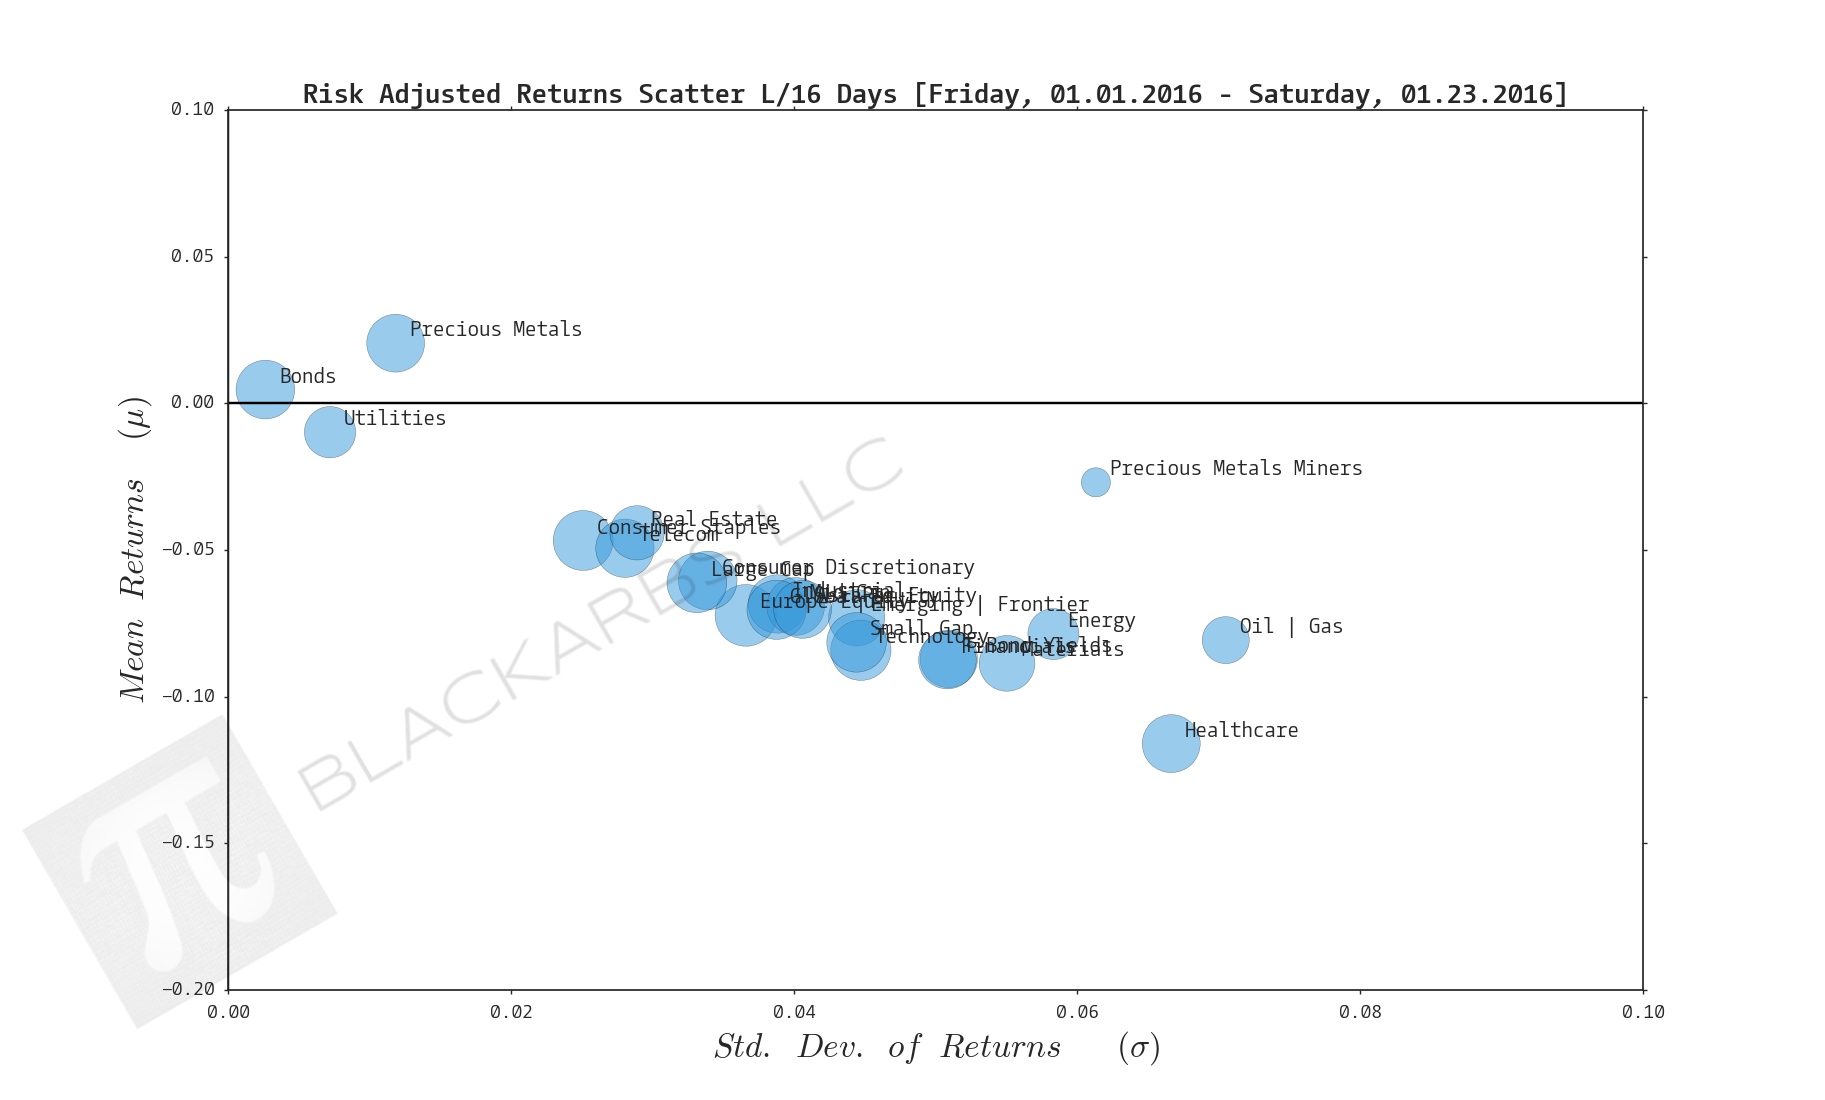
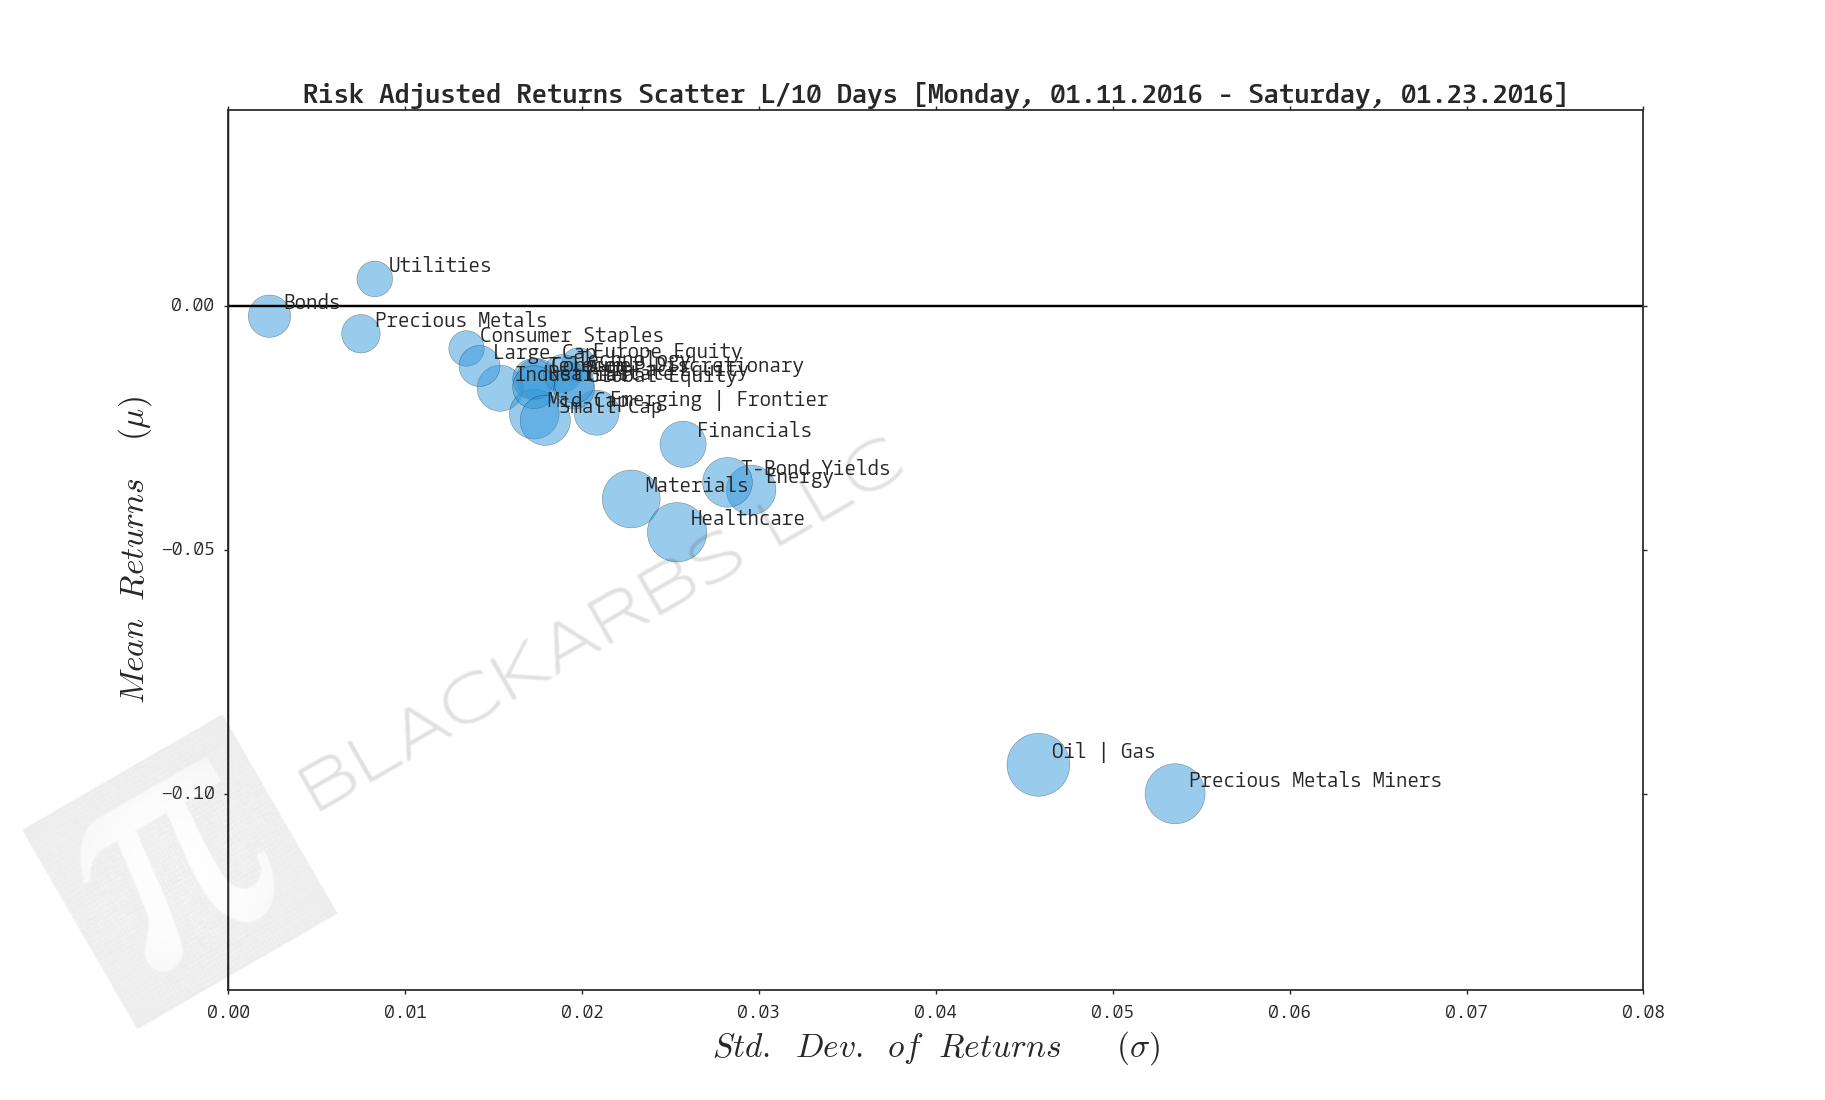
Composite ETF Risk-Adjusted Returns Scatter plot (Std vs Mean)
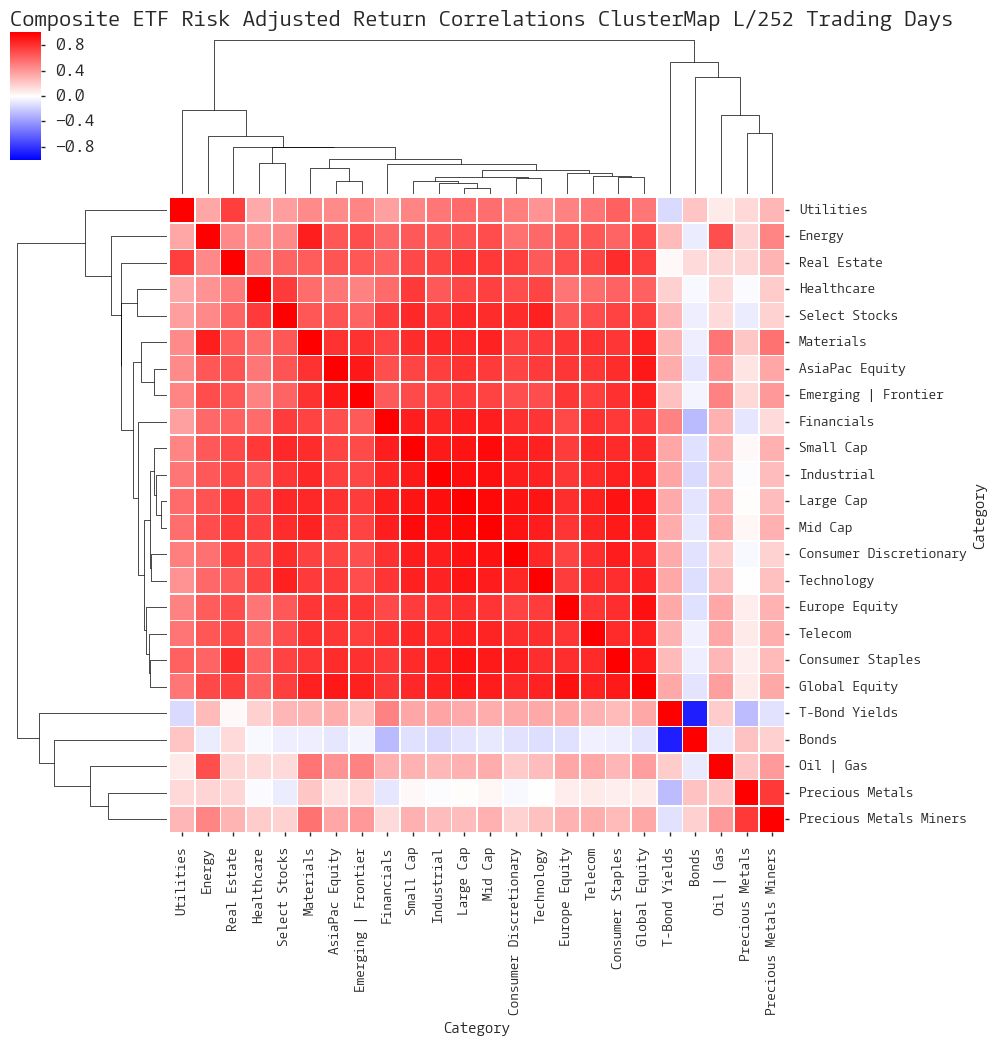
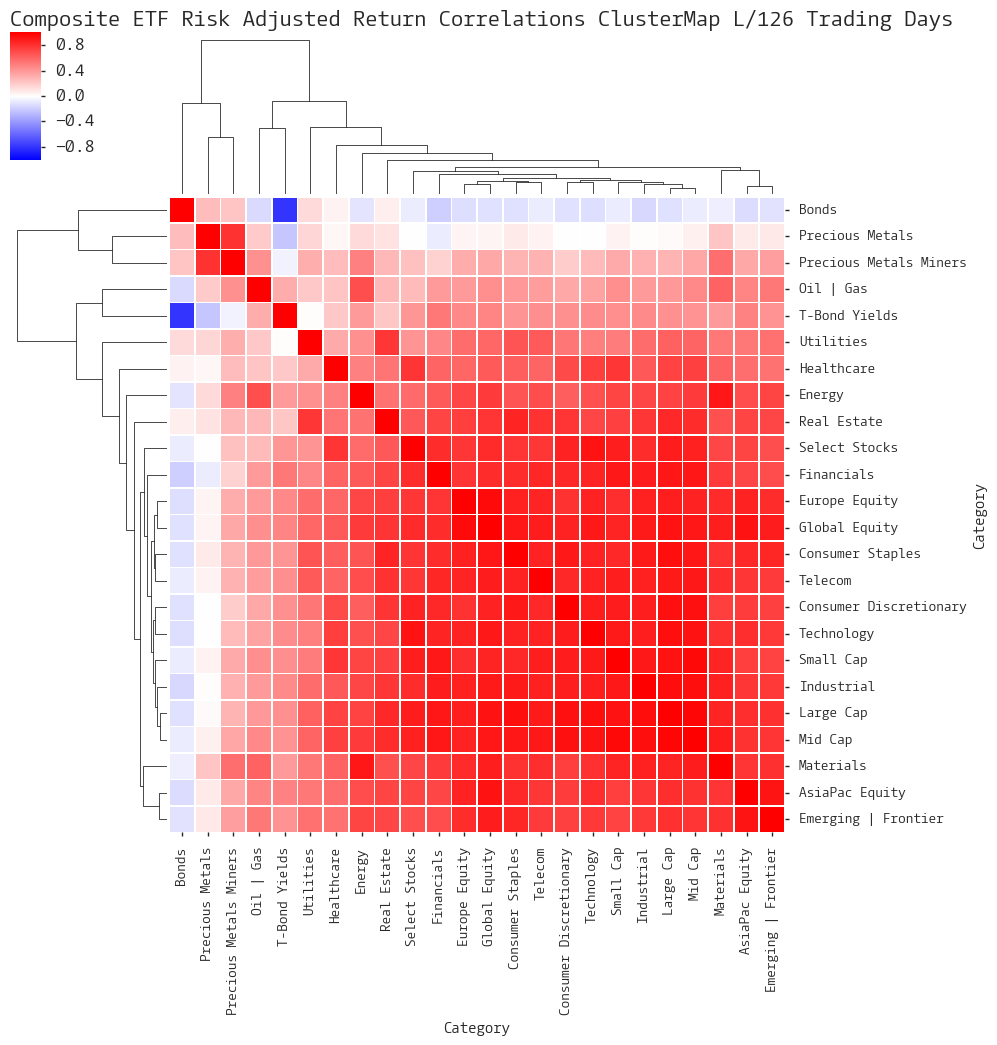
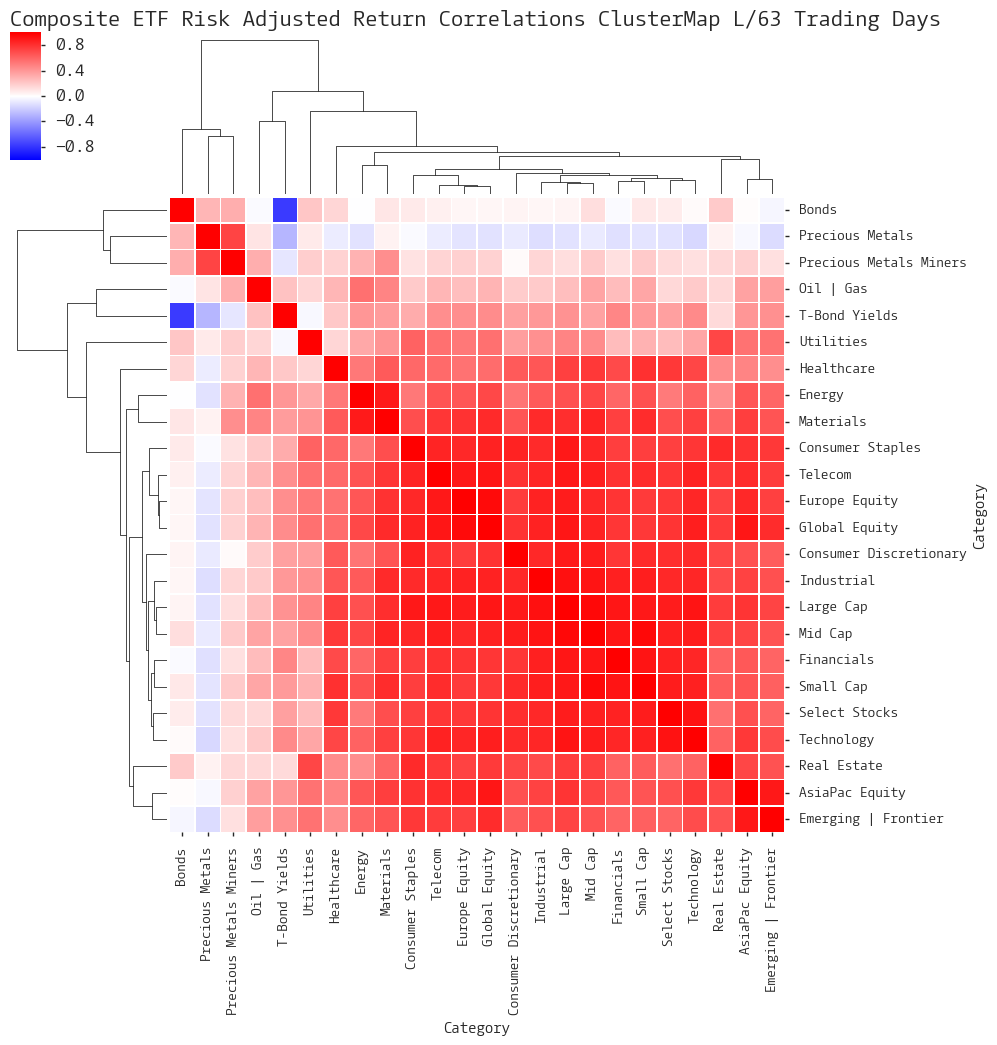
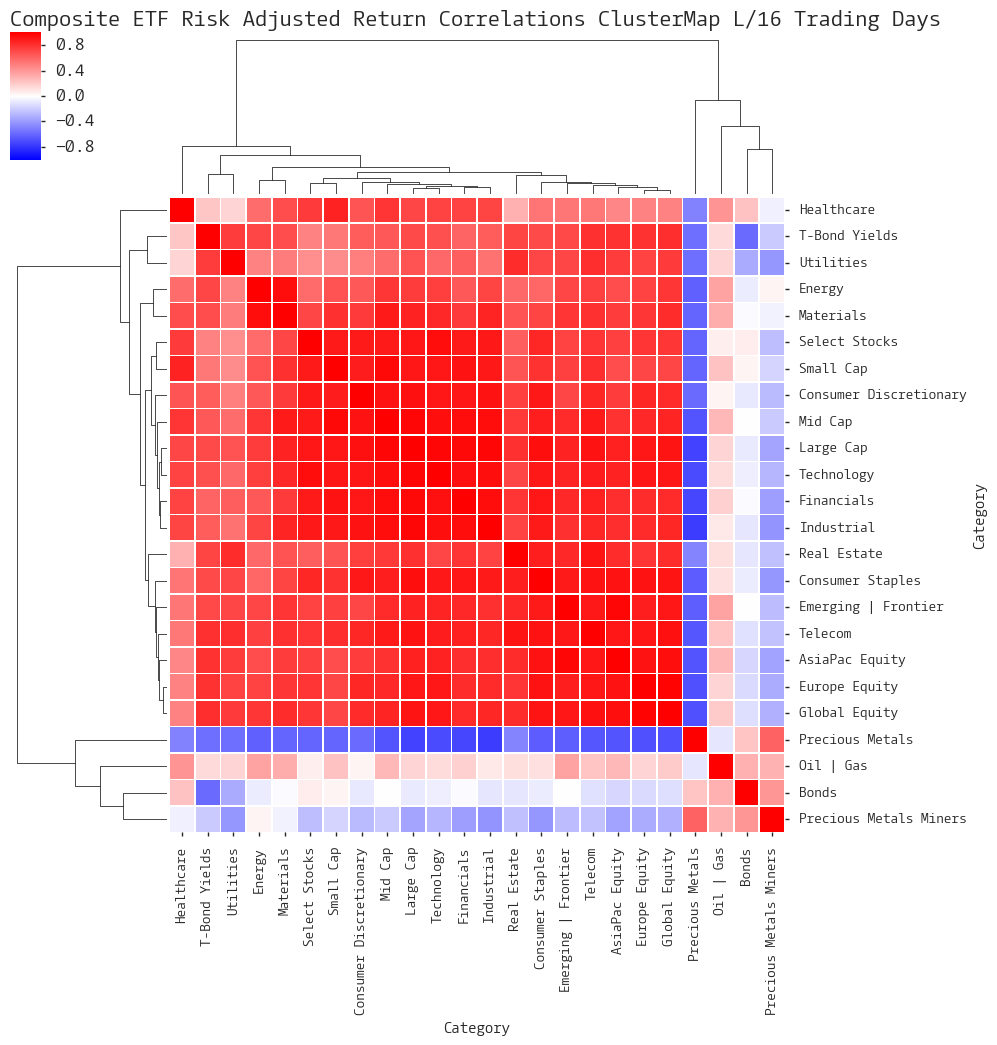
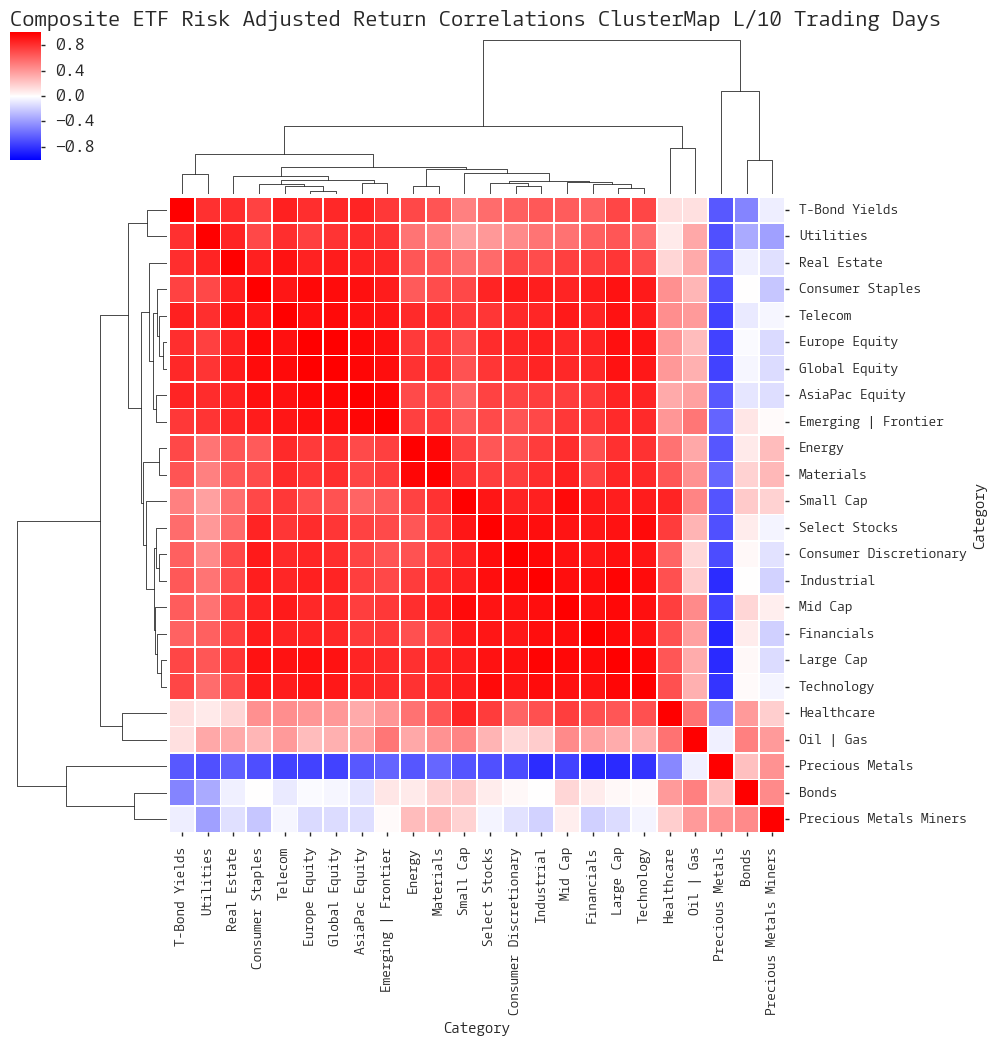
Composite ETF Risk-Adjusted Return Correlations Heatmap (Clusterplot)
Composite ETF Cumulative Return Tables
Notable Trends and Observations
COMPOSITE ETF COMPONENTS:
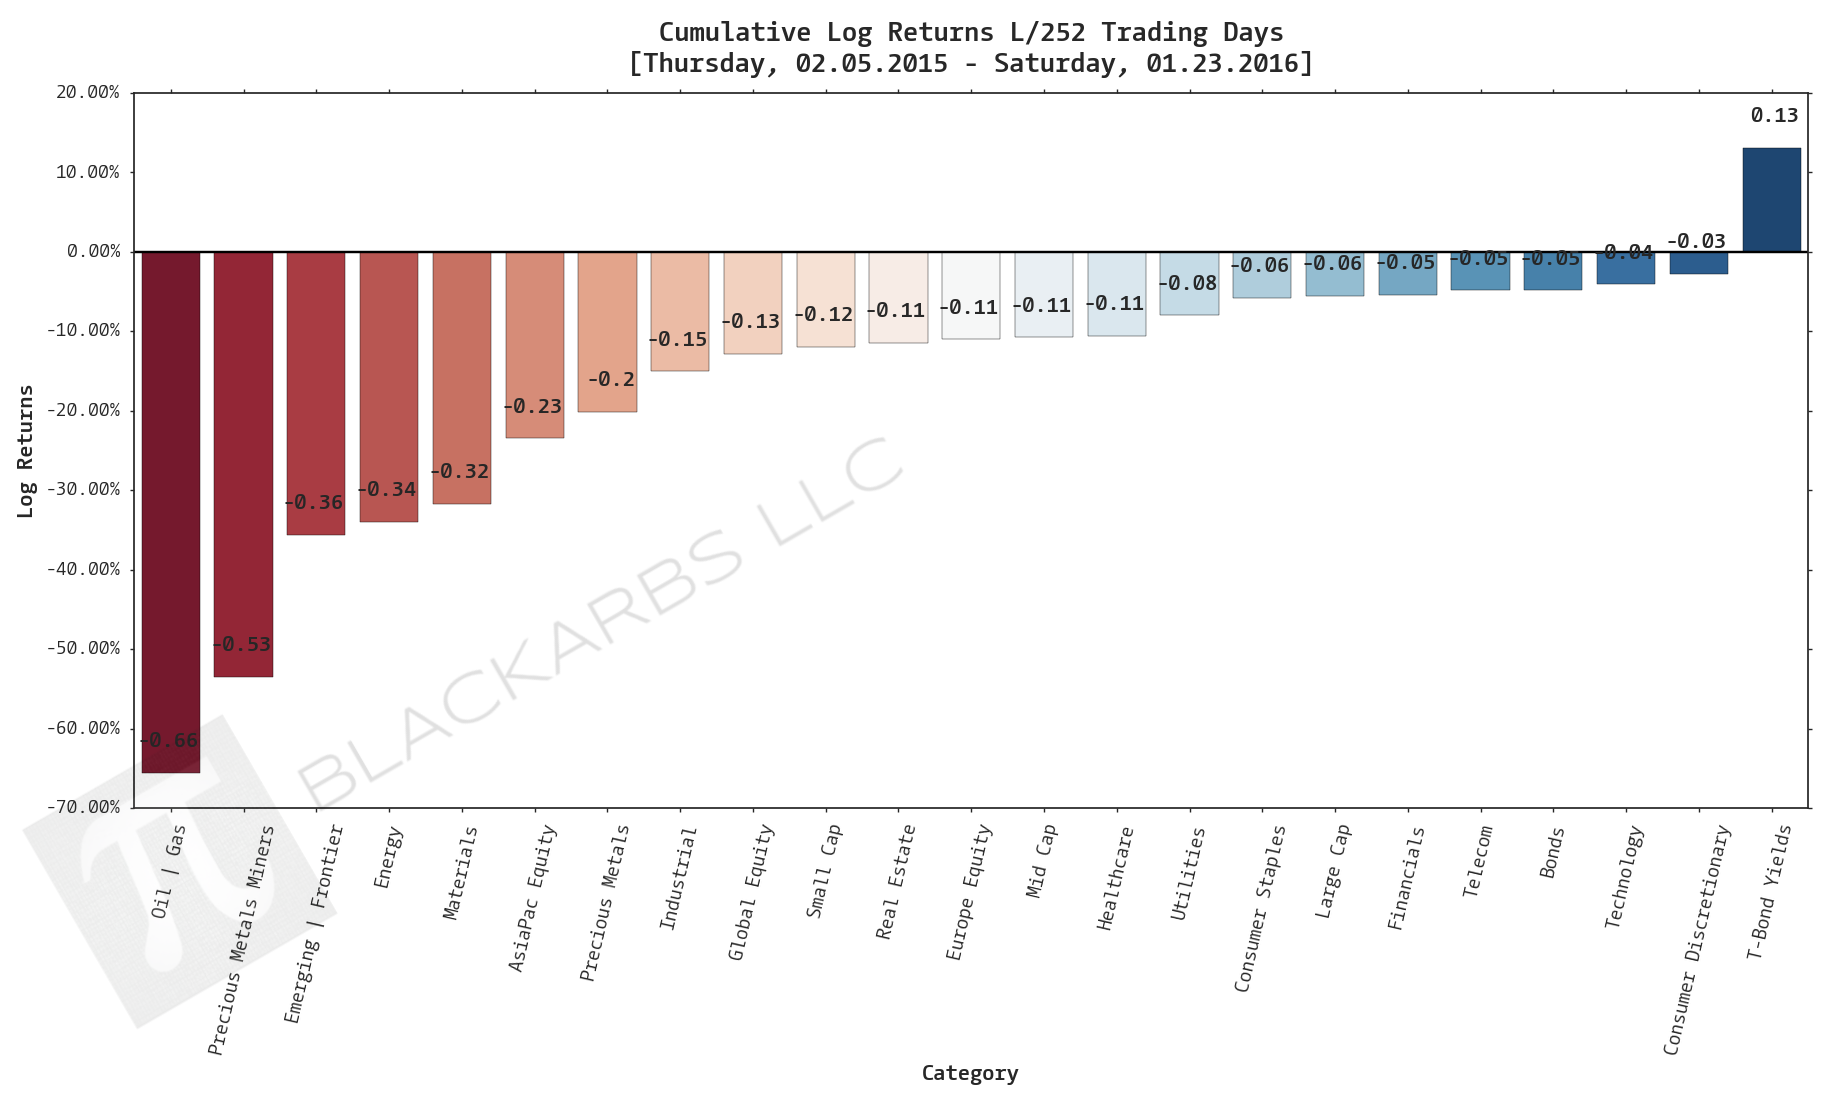
LAST 252 TRADING DAYS

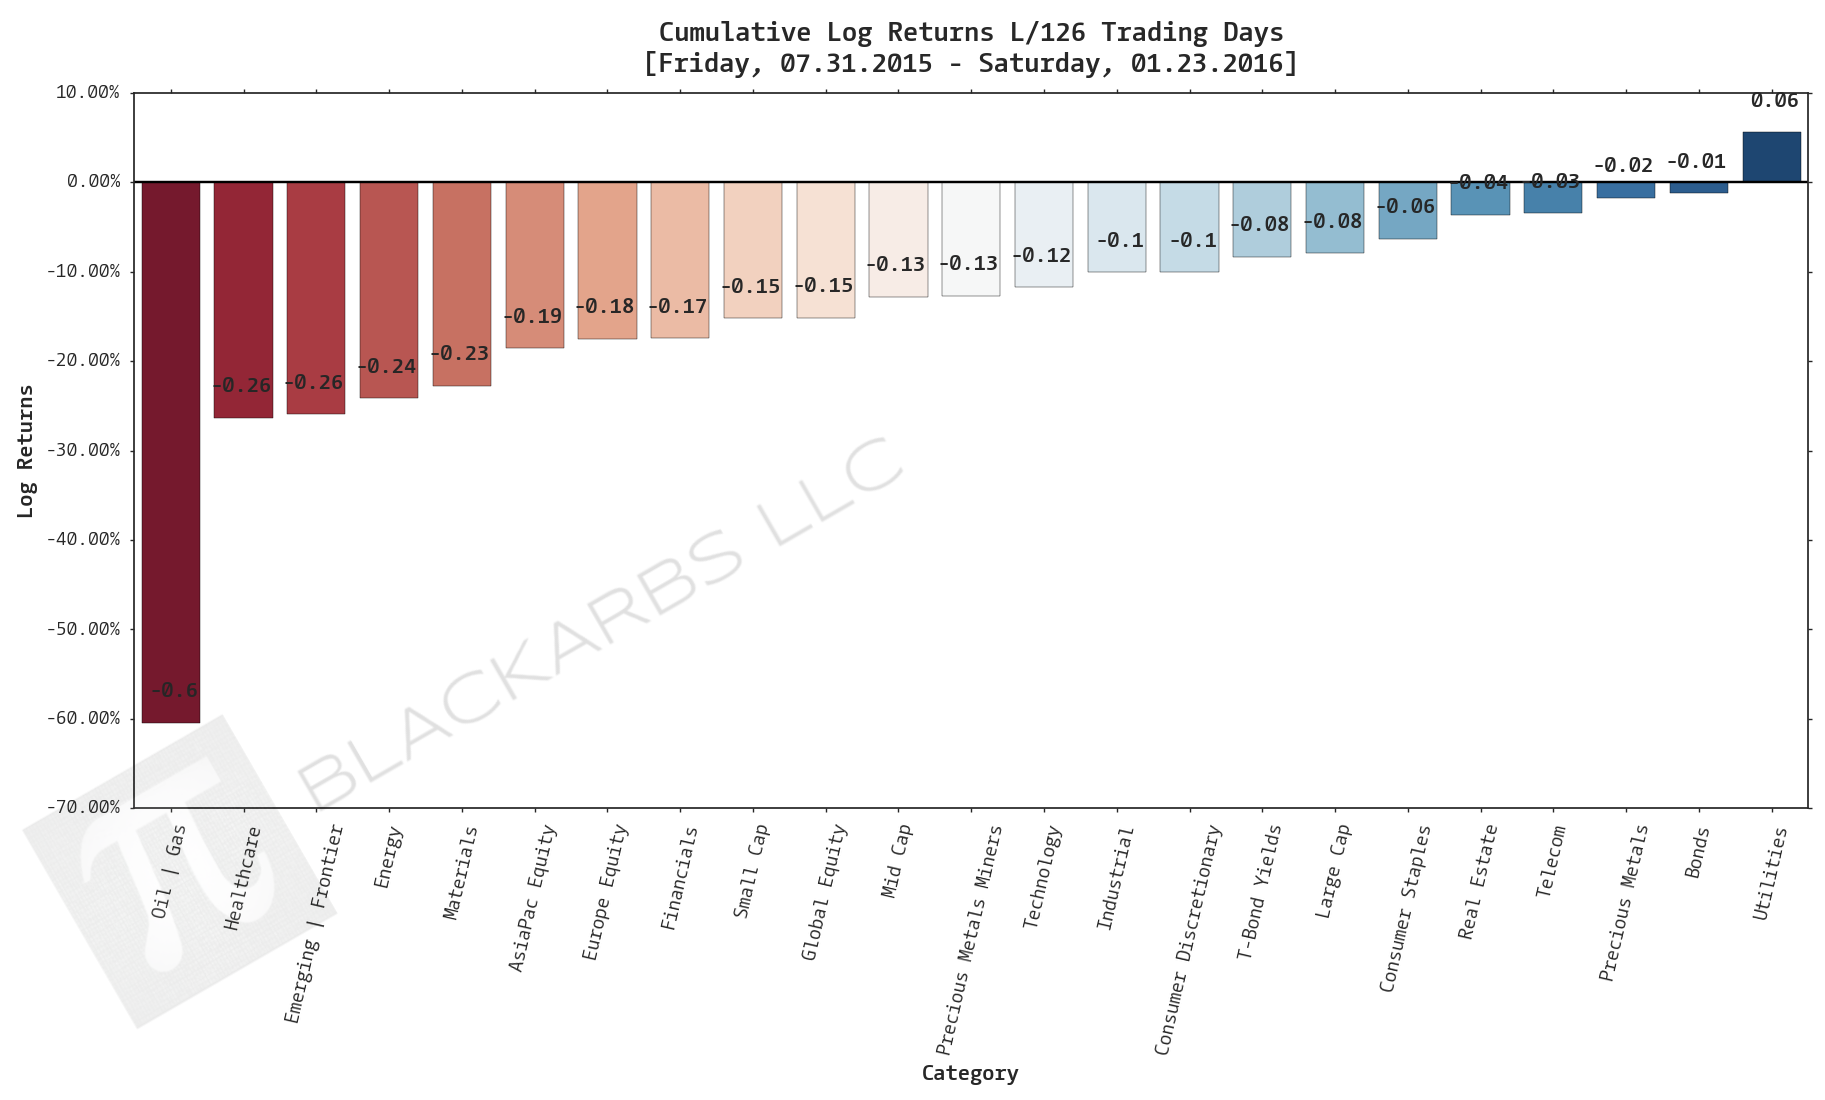
LAST 126 TRADING DAYS
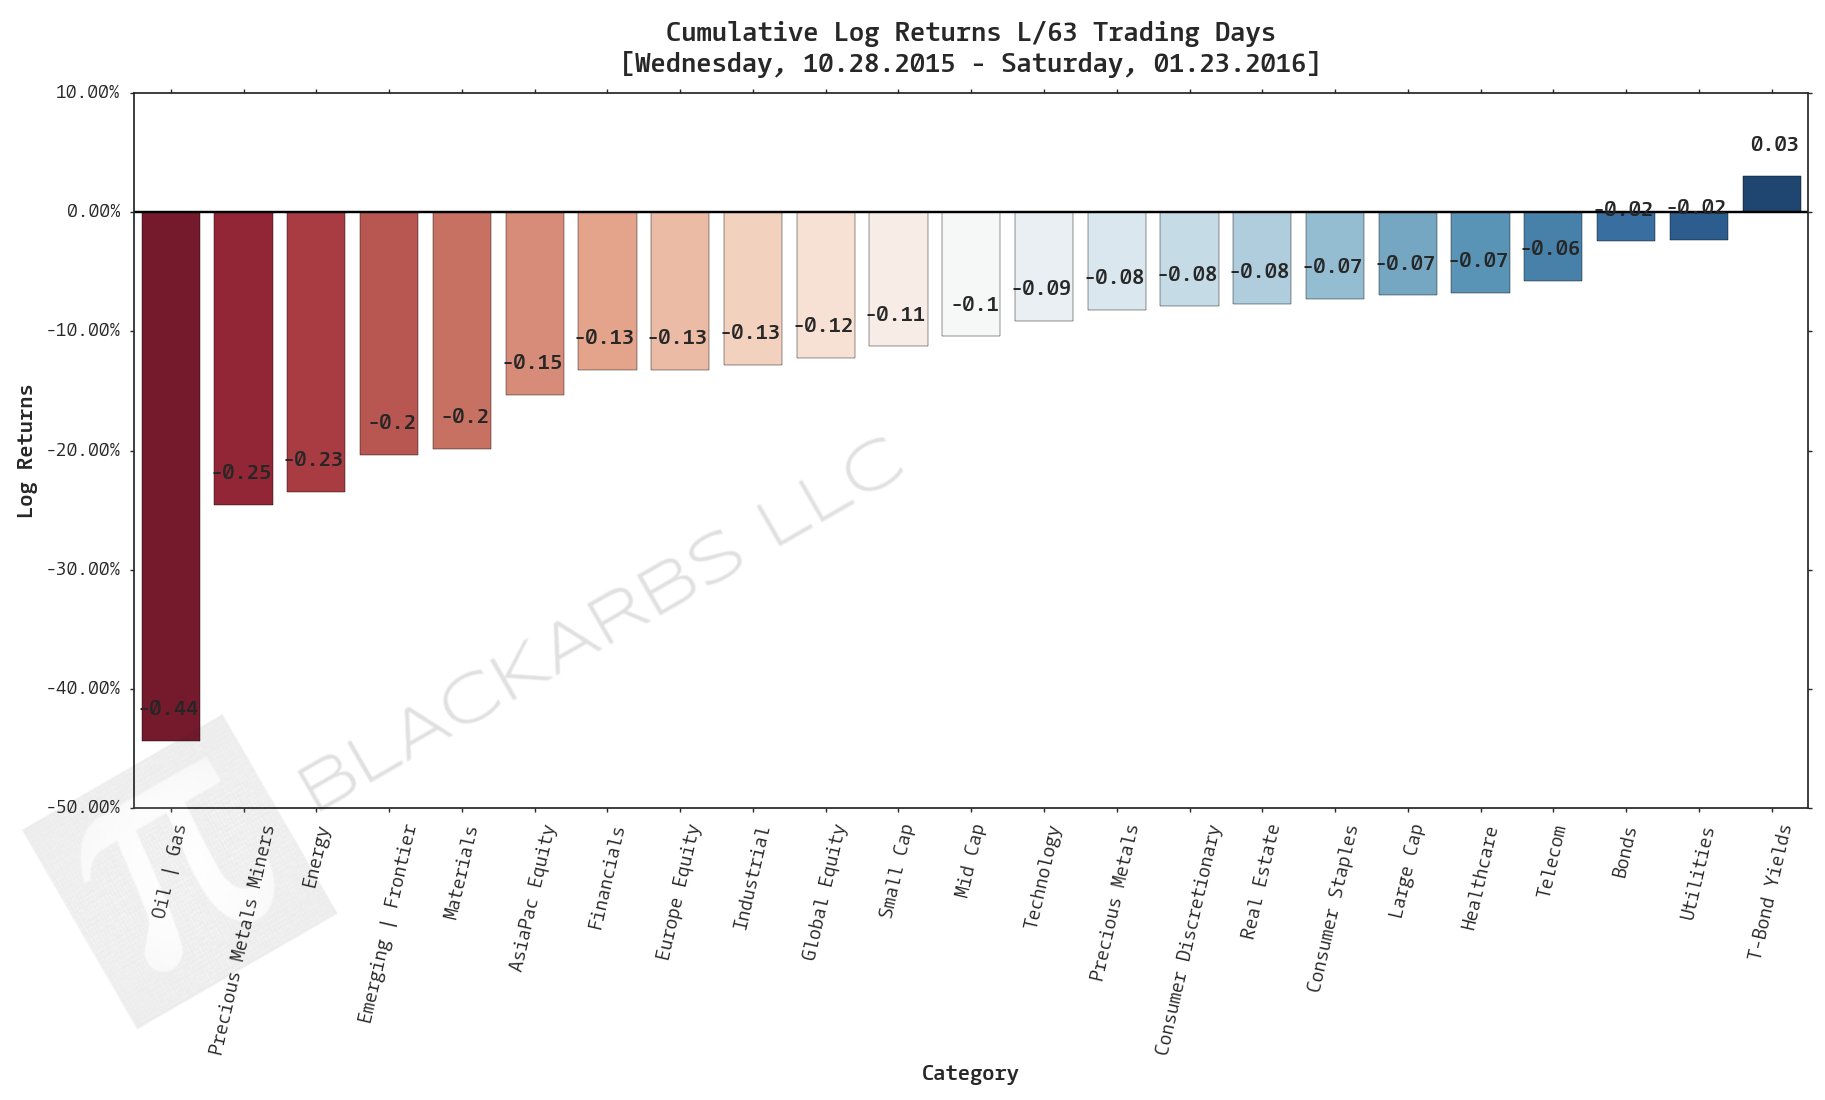
LAST 63 TRADING DAYS
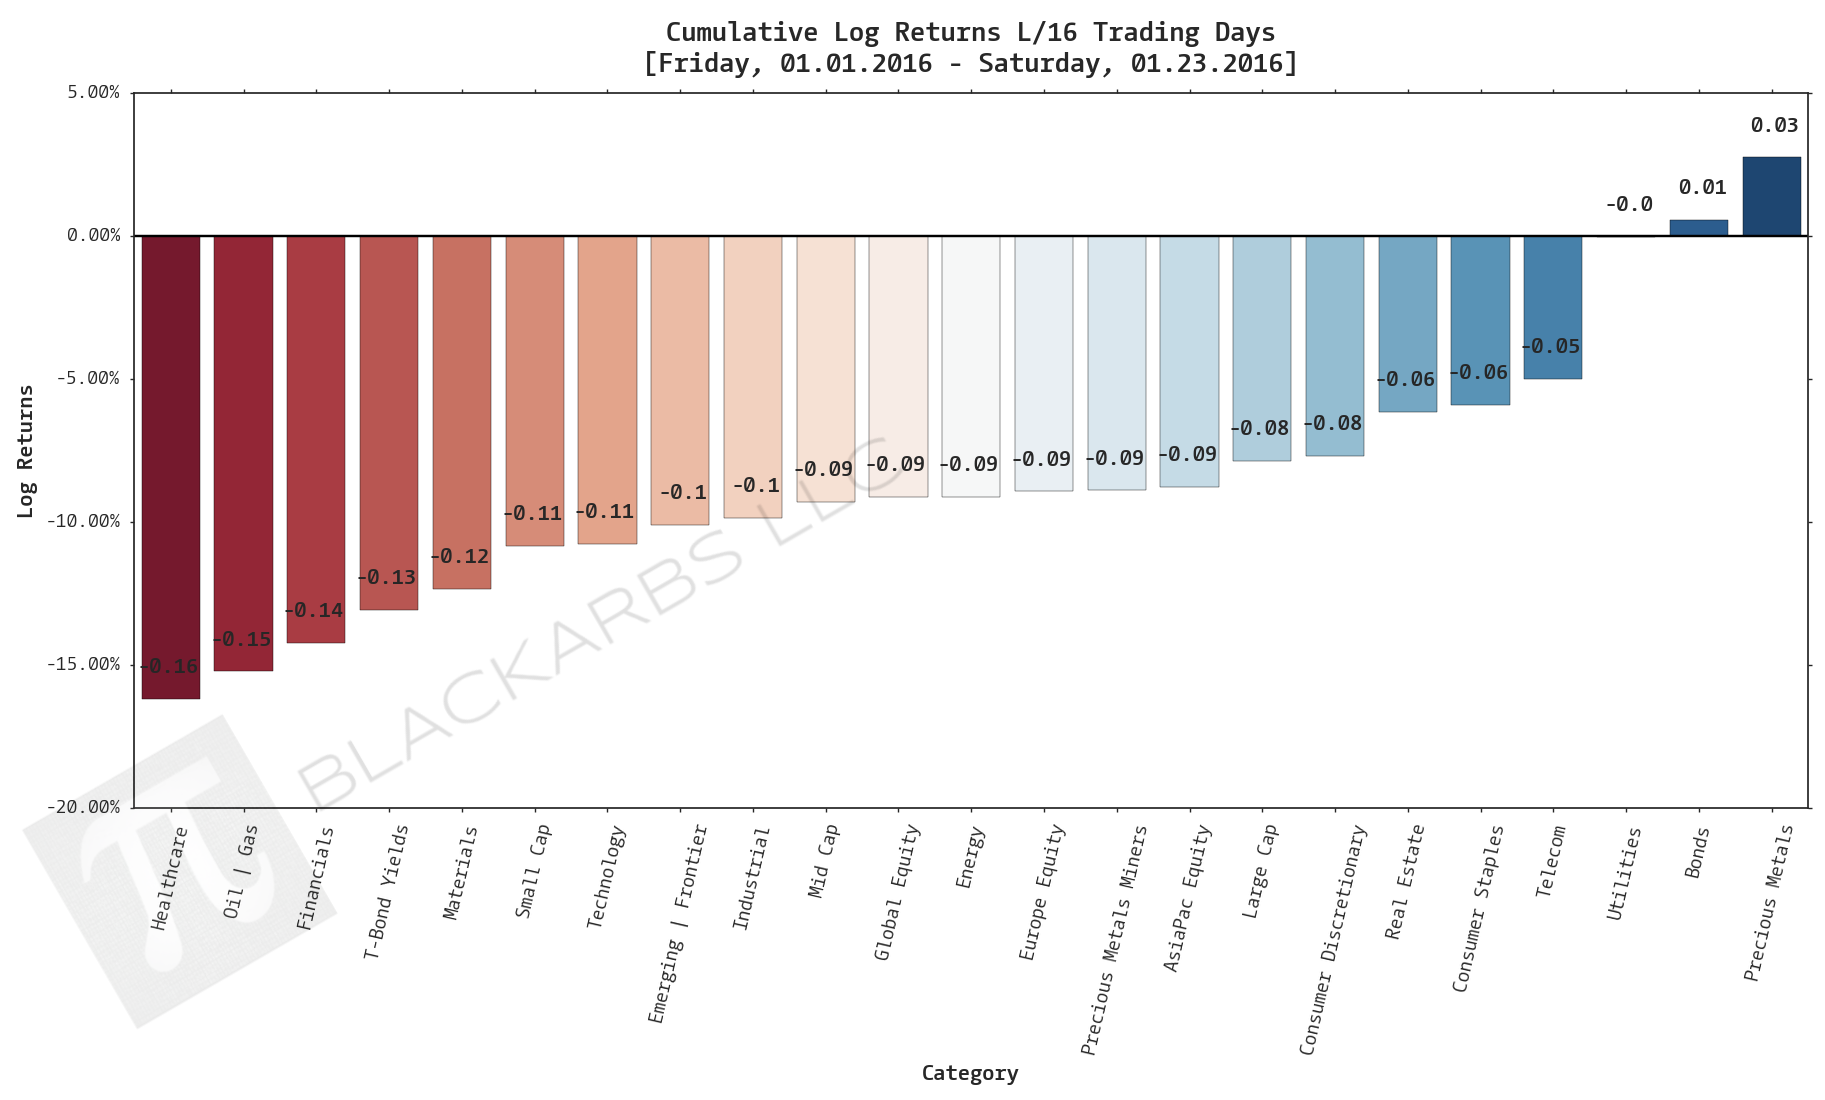
YTD LAST 16 TRADING DAYS
LAST 10 TRADING DAYS
Cumulative Return Tables:
Notable Observations and Trends:
- Of the top 3 performers in each time frame at least one composite had negative performance.
- Precious Metals Minors losing ~13% over the last 10 days is indicative of a near term bottom as Miners and Precious Metals had been showing relative strength during the recent selloff.
- Precious Metals have been the only composite providing negatively correlated returns (diversification).
- The Oil + Gas composite has been a bottom 3 performer across all time frames and has been the most consistent short across the last 252 trading days.
