

Backtesting the Implied Volatility Strategy - A Deeper Dive (10/03/16)
/Post Outline
- Strategy Summary
- References
- 4-Week Holding Period Strategy Update
- 1-Week Holding Period Strategy Updated (Target Leverage=2)
- Deep Dive into the Weekly Strategy using Quantopian's Pyfolio
- Strategy Concerns
Strategy Summary
This is a stylized implementation of the strategy described in the research paper titled "What Does Individual Option Volatility Smirk Tell Us About Future Equity Returns?" by Yuhang Xing, Xiaoyan Zhang and Rui Zhao. The authors show that their SKEW factor predicts individual equity returns up to 6 months!
ABSTRACT
The shape of the volatility smirk has significant cross-sectional predictive power for future equity returns. Stocks exhibiting the steepest smirks in their traded options underperform stocks with the least pronounced volatility smirks in their options by around 10.9% per year on a risk-adjusted basis. This predictability persists for at least six months, and firms with the steepest volatility smirks are those experiencing the worst earnings shocks in the following quarter. The results are consistent with the notion that informed traders with negative news prefer to trade out-of-the-money put options, and that the equity market is slow in incorporating the information embedded in volatility smirks. [1]
Here is the skew measure they use.
My strategy differs in that I arbitrarily chose 1 and 4 week holding periods to study. Additionally this strategy only analyzes a cross-section of ETFs instead of individual stocks. I chose ETFs because liquidity and data quality concerns are minimized. Here are the selected ETFs under analysis.
References:
- Zhang, Xiaoyan and Zhao, Rui and Xing, Yuhang, What Does Individual Option Volatility Smirk Tell Us About Future Equity Returns? (August 14, 2008). AFA 2009 San Francisco Meetings Paper. Available at SSRN:http://ssrn.com/abstract=1107464 orhttp://dx.doi.org/10.2139/ssrn.1107464
4-Week Holding Period Strategy Update
**Results simulated using the Quantopian platform.
Download the spreadsheet here.
Download a text file of all the portfolio stocks here.
1-Week Holding Period Strategy Update (Target Leverage=2)
RESULTS SIMULATED USING QUANTOPIAN PLATFORM
Deep Dive into the Weekly Strategy using Quantopian's Pyfolio
Here I use Quantopian's portfolio analytics tool to further analyze the strategy. Note that all returns are simulated.
Annualized returns are extremely healthy at 26% with annualized volatility in the single digits. The sharpe ratio is impressive at 3.2 and the calmar ratio is double digits reflecting the low maximum drawdown this strategy has sustained. Some features we would hope for include a positive skew which indicates a higher likelihood of positive returns. Annualized alpha is substantial at 22% while maintaining very low beta exposure to the benchmark (SPY) at 10%. These numbers are fantastic but we must pump the brakes on our excitement as the strategy only has 9 months of results. Furthermore, at least 1.5 of the 9 months the strategy was not tracked due to the downfall of the Yahoo Finance options API.

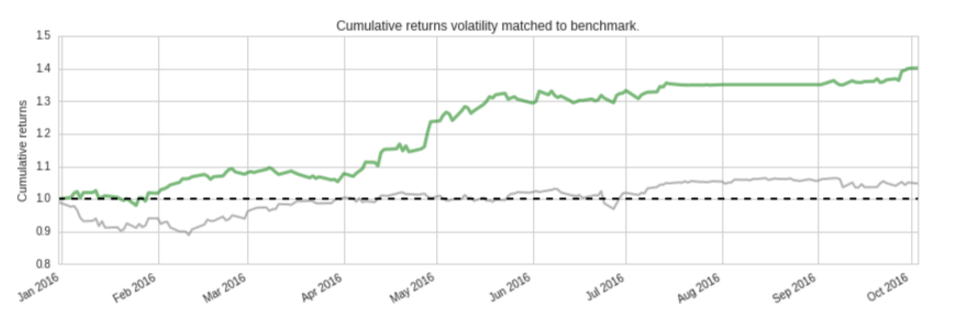
A quick glance shows that the strategy has had strong cumulative return performance over the first three quarters of 2016. We can see the gap in the strategy results during the period I was searching for a new options data provider.
Monthly and weekly returns skew to the positive. The only losing month thus far appears to be March. Even without the near ~8% gain in April the strategy still skews positively.

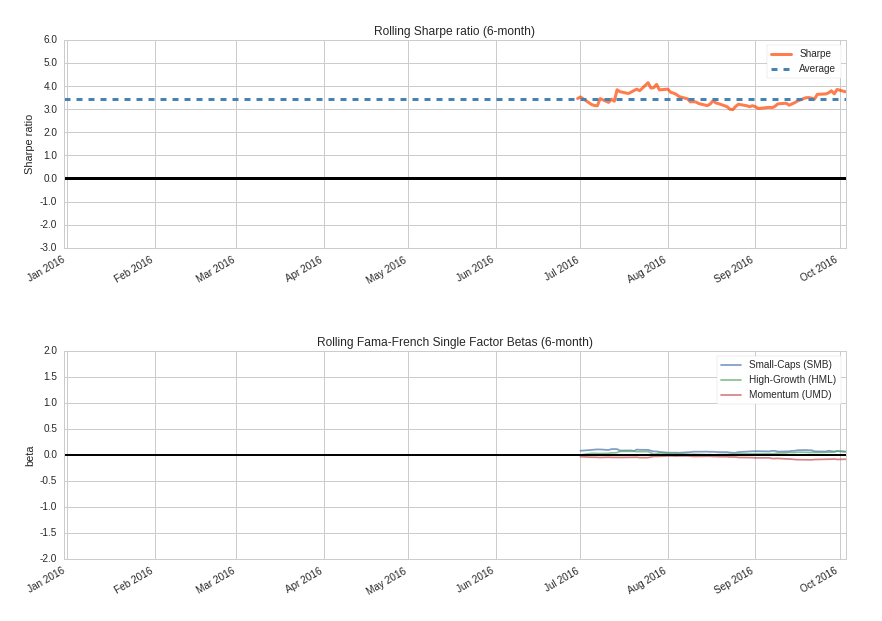
Rolling portfolio beta relative to the SPY benchmark is near zero. Six month rolling sharpe has been consistently high around 3 for the last three months. The strategy has near zero sensitivity to the rolling Fama-French factors which is a positive sign.
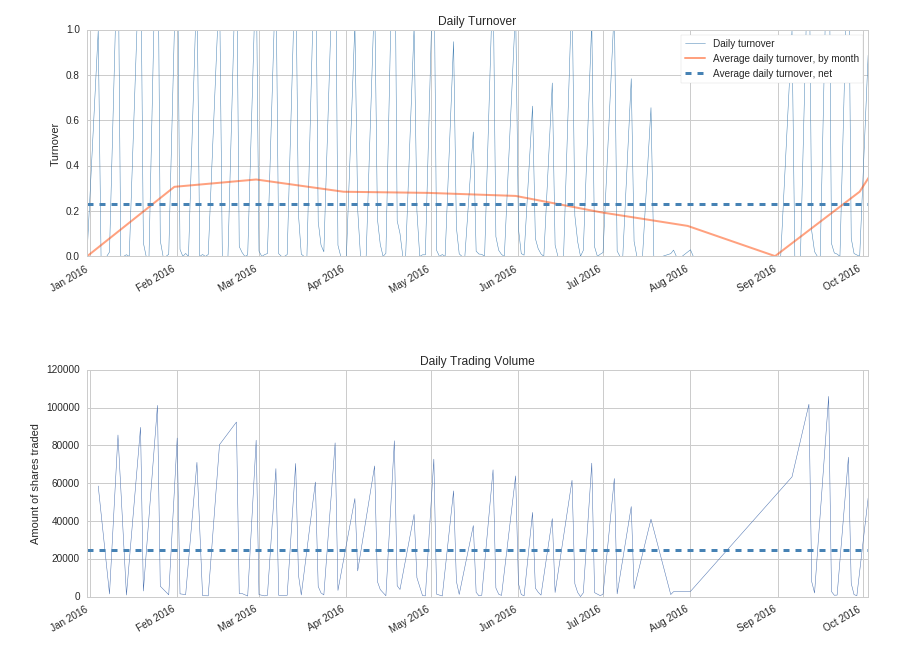

This strategy turns over almost once a week, as designed, with daily trading volume averaging a little over 20,000 shares. Gross leverage very rarely exceeds two. Based on the gross leverage we can see that the strategy struggles to get filled on the more thinly traded ETFs which results in the gross leverage rarely achieving its target leverage of two. This includes my custom slippage model which increases the bar volume limit to 50%, which means up to 50% of a minutes bar's volume can be traded by the strategy.
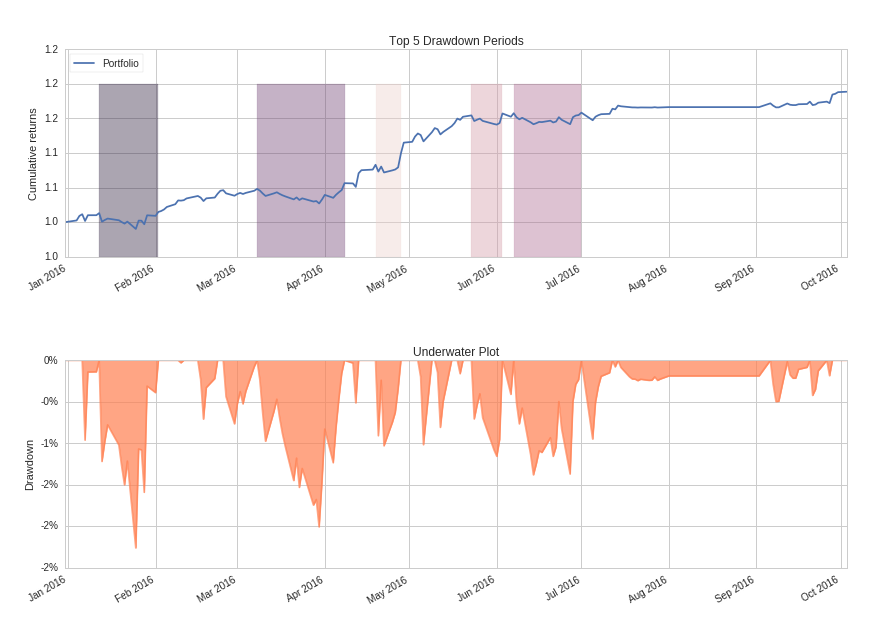

Drawdowns have been manageable and very small, with the max at 2.26% only lasting 16 days. Max drawdown duration has been approximately 1 month or 24 days.


Here are the maximum long and short portfolio weights. ~22% isn't awful but it's not ideal. Again this is a reflection of slippage and lack of timely fills. However it is not all bad as seen below.
Clearly those overweight positions are the result of slippage during portoflio turnover as those allocations are represented by short duration spikes on both the long and short side in the Portfolio Allocation Over Time plot. More importantly, in the Long/Short Max and Median Position Concentration chart we can see that during the position weight spikes, the portfolio has had near offsetting positions such that it is not unhedged or overexposed to either the long or short side for long periods of time. We can confirm this by plotting the net leverage and average net leverage.
Let's examine some trading statistics.
First item that jumps out is the quantity of losing round_trips is greater than winning round_trips for short trades which is interesting. Only 38% of the short trades are profitable. However, look at the Profit factor row. For short trades it is very close to 1 indicating near breakeven. How is that possible? Look at the Ratio Avg. Win:Avg Loss. Short trades have the highest ratio at $1.58. This means that average winning trade is almost 1.6x the size of the average losing trade in dollar terms. The Profit factor for the long trades is a healthy $1.93 and the strategy overall shows an investable profit factor of $1.41.
Strategy Concerns
The strategy looks great overall. However there are key concerns that must be highlighted. I will do so in bullet form:
- Small sample size incorporates only 9 months of data, ~1.5 months the strategy was not tracked.
- Liquidity and slippage can be an issue when the strategy is run live. The question is, is there more liquidity available for some of the thinly traded ETFs, during live trading that is not reflected in historical volume, due to the creation/redemption process?
- If gross and net leverage are brought into better balance the strategy returns could differ from the simulation results for better or for worse.
- Execution and commission costs could, in theory, be improved and/or reduced for the benefit of the strategy due to the algorithm's high turnover. This gives the portfolio manager/administrator leverage in negotiating commissions.
- Bad data is always a concern that could bias the simulation results up or down.
- Simulated results can be substantially different from live trading results.
