COMPOSITE MACRO ETF WEEKLY ANALYTICS (3/19/2016)

COMPOSITE MACRO ETF WEEKLY ANALYTICS (3/19/2016)

Notable Observations and Trends:

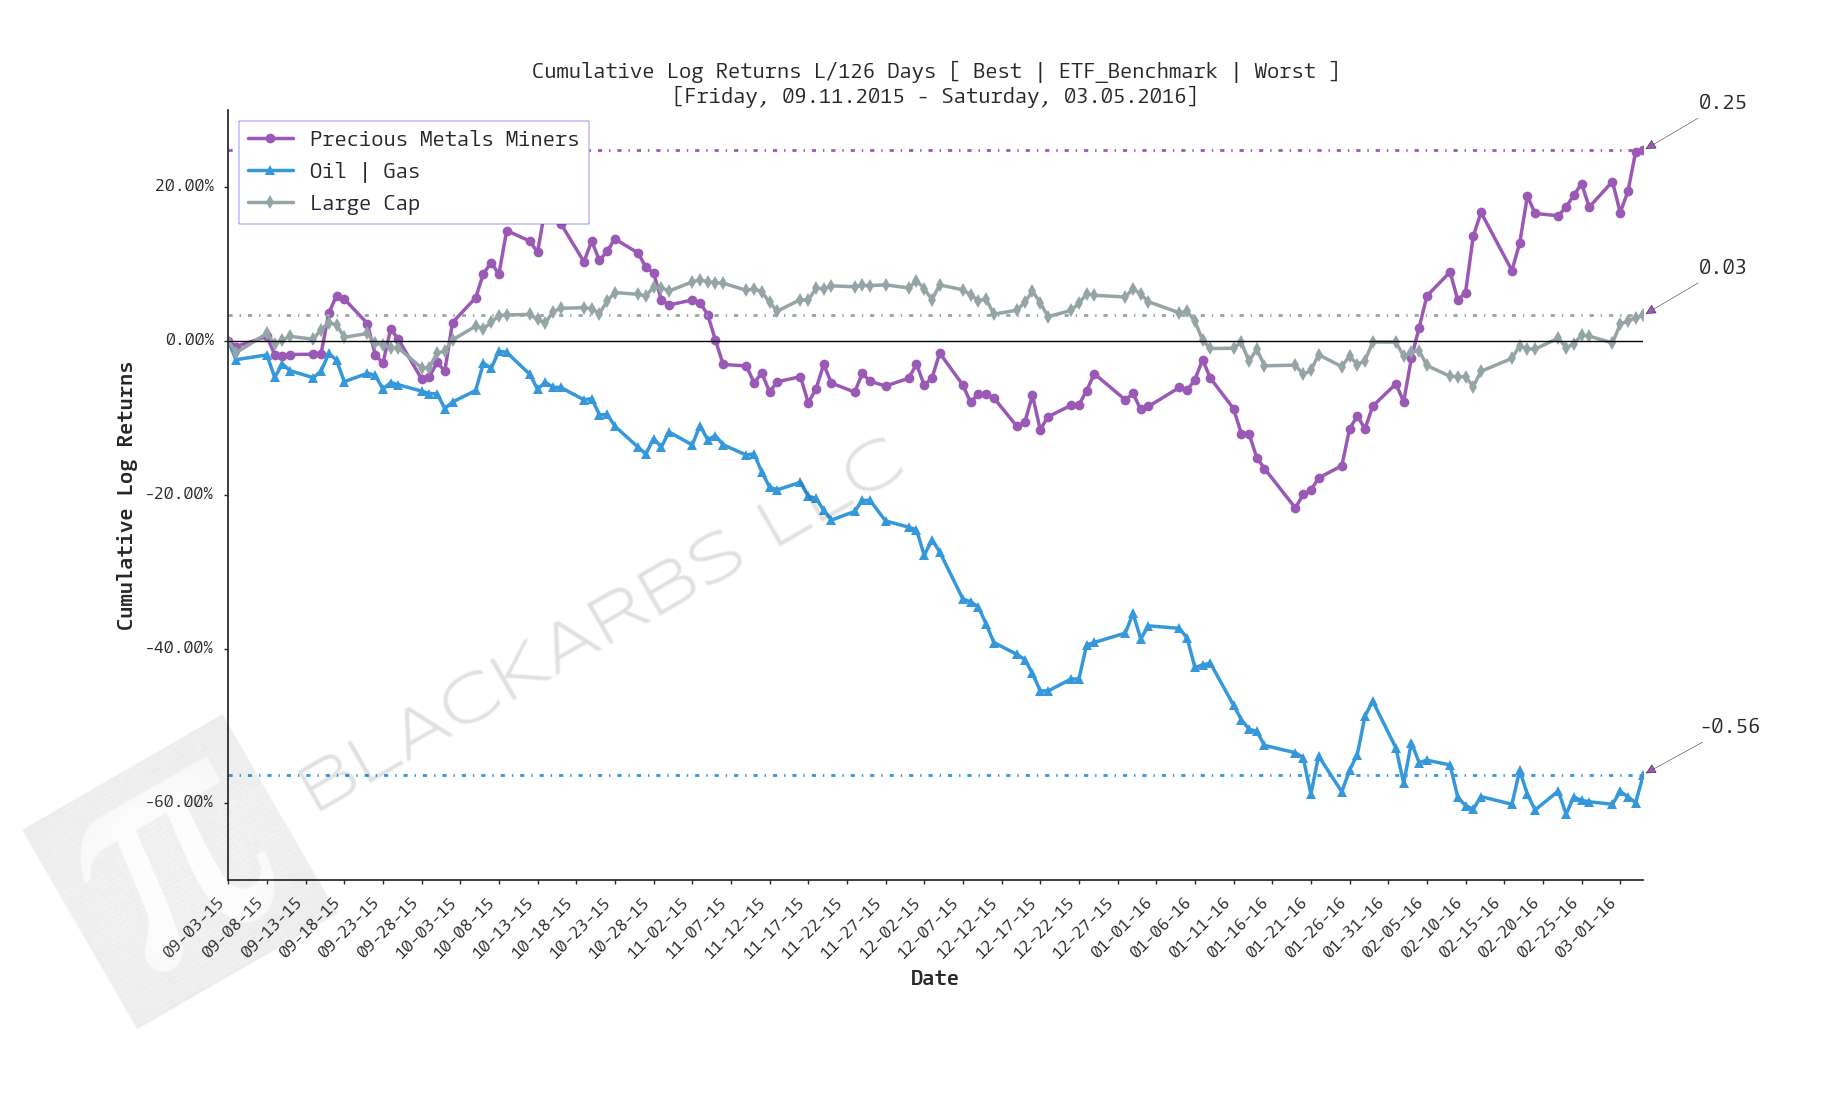
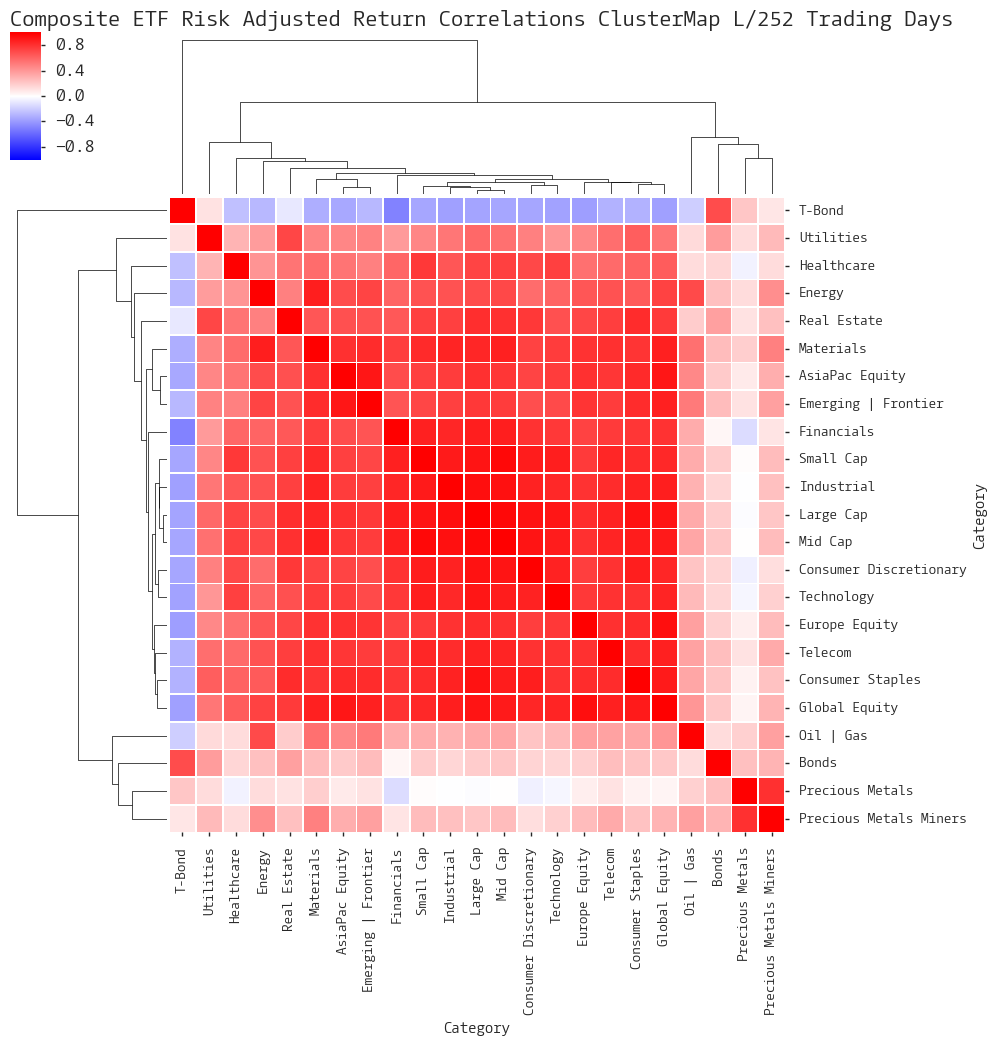
  • Last 252 days the only Composites with positive returns are the "defensive" sectors: Utilities, Consumer Staples, Telecom, Precious Metals, and Treasuries
  • Last 252 days all Composites have negative rolling risk adjusted returns as shown in the Scatterplot.
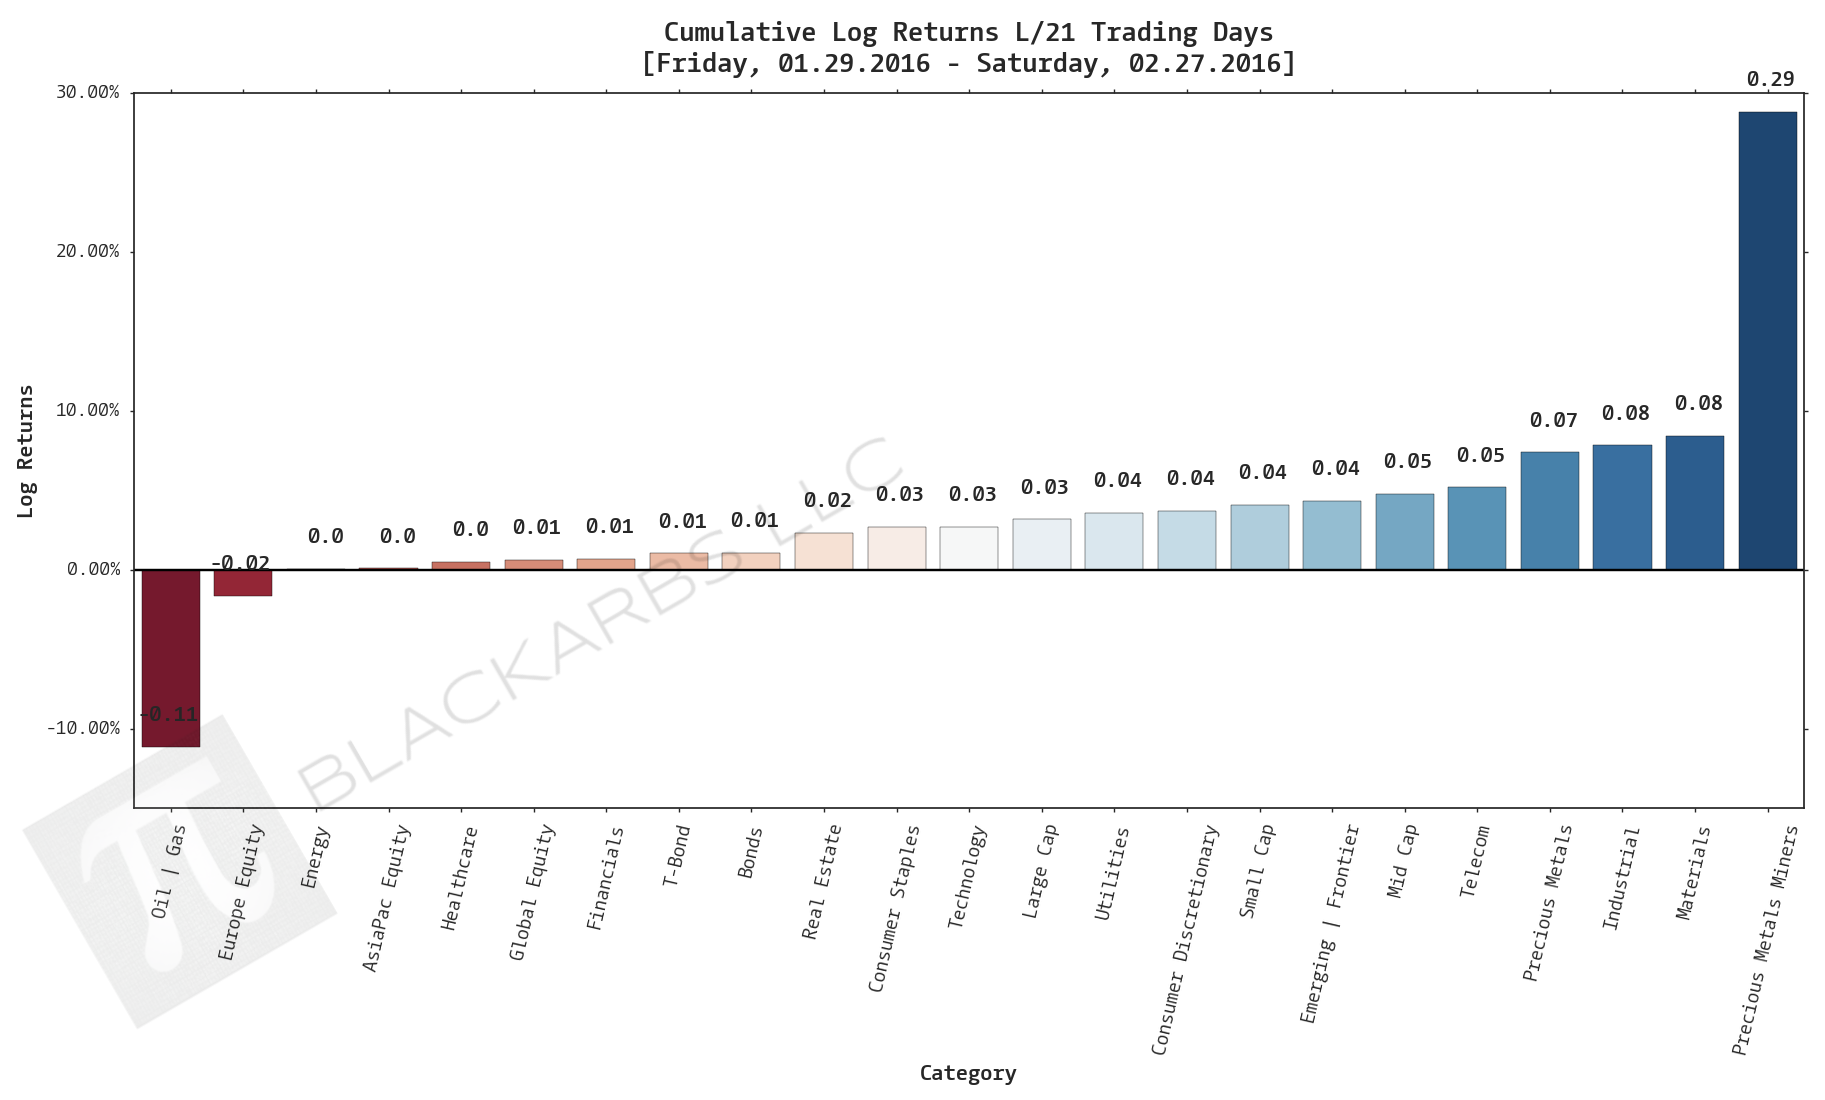
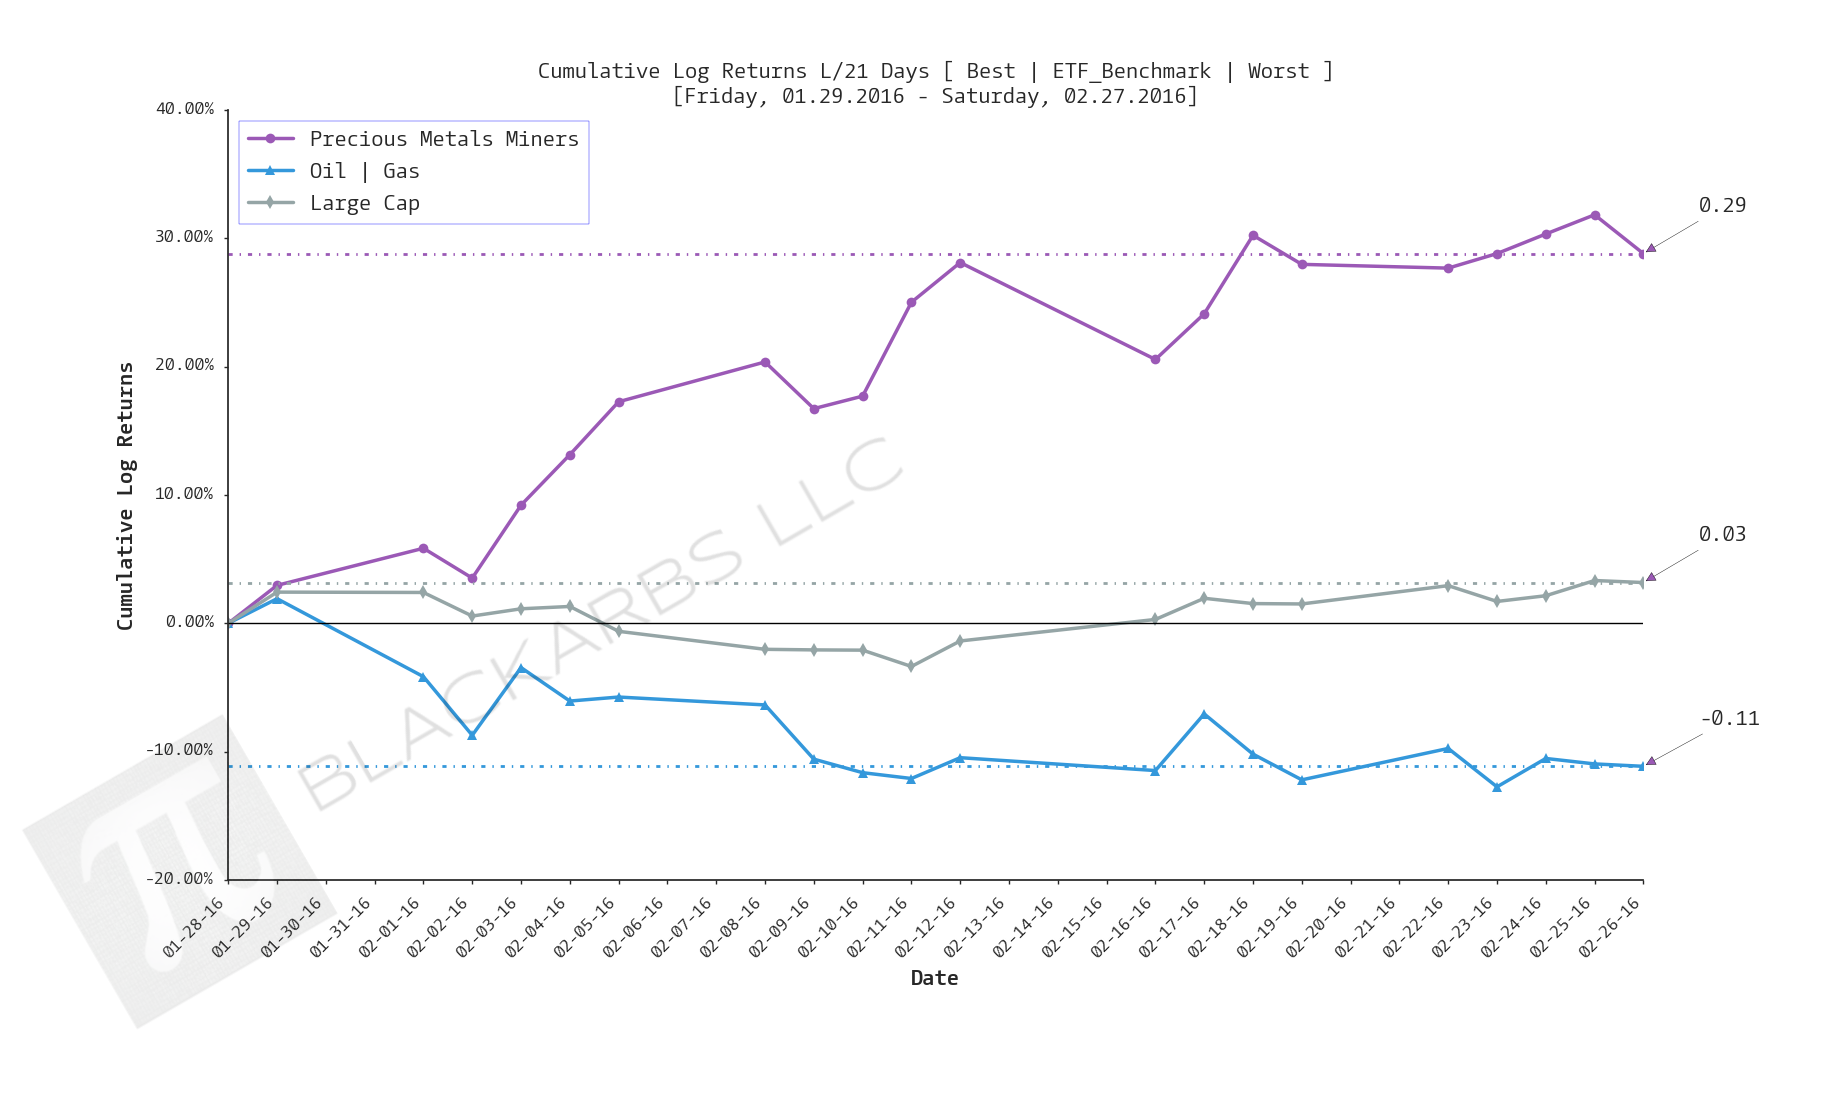
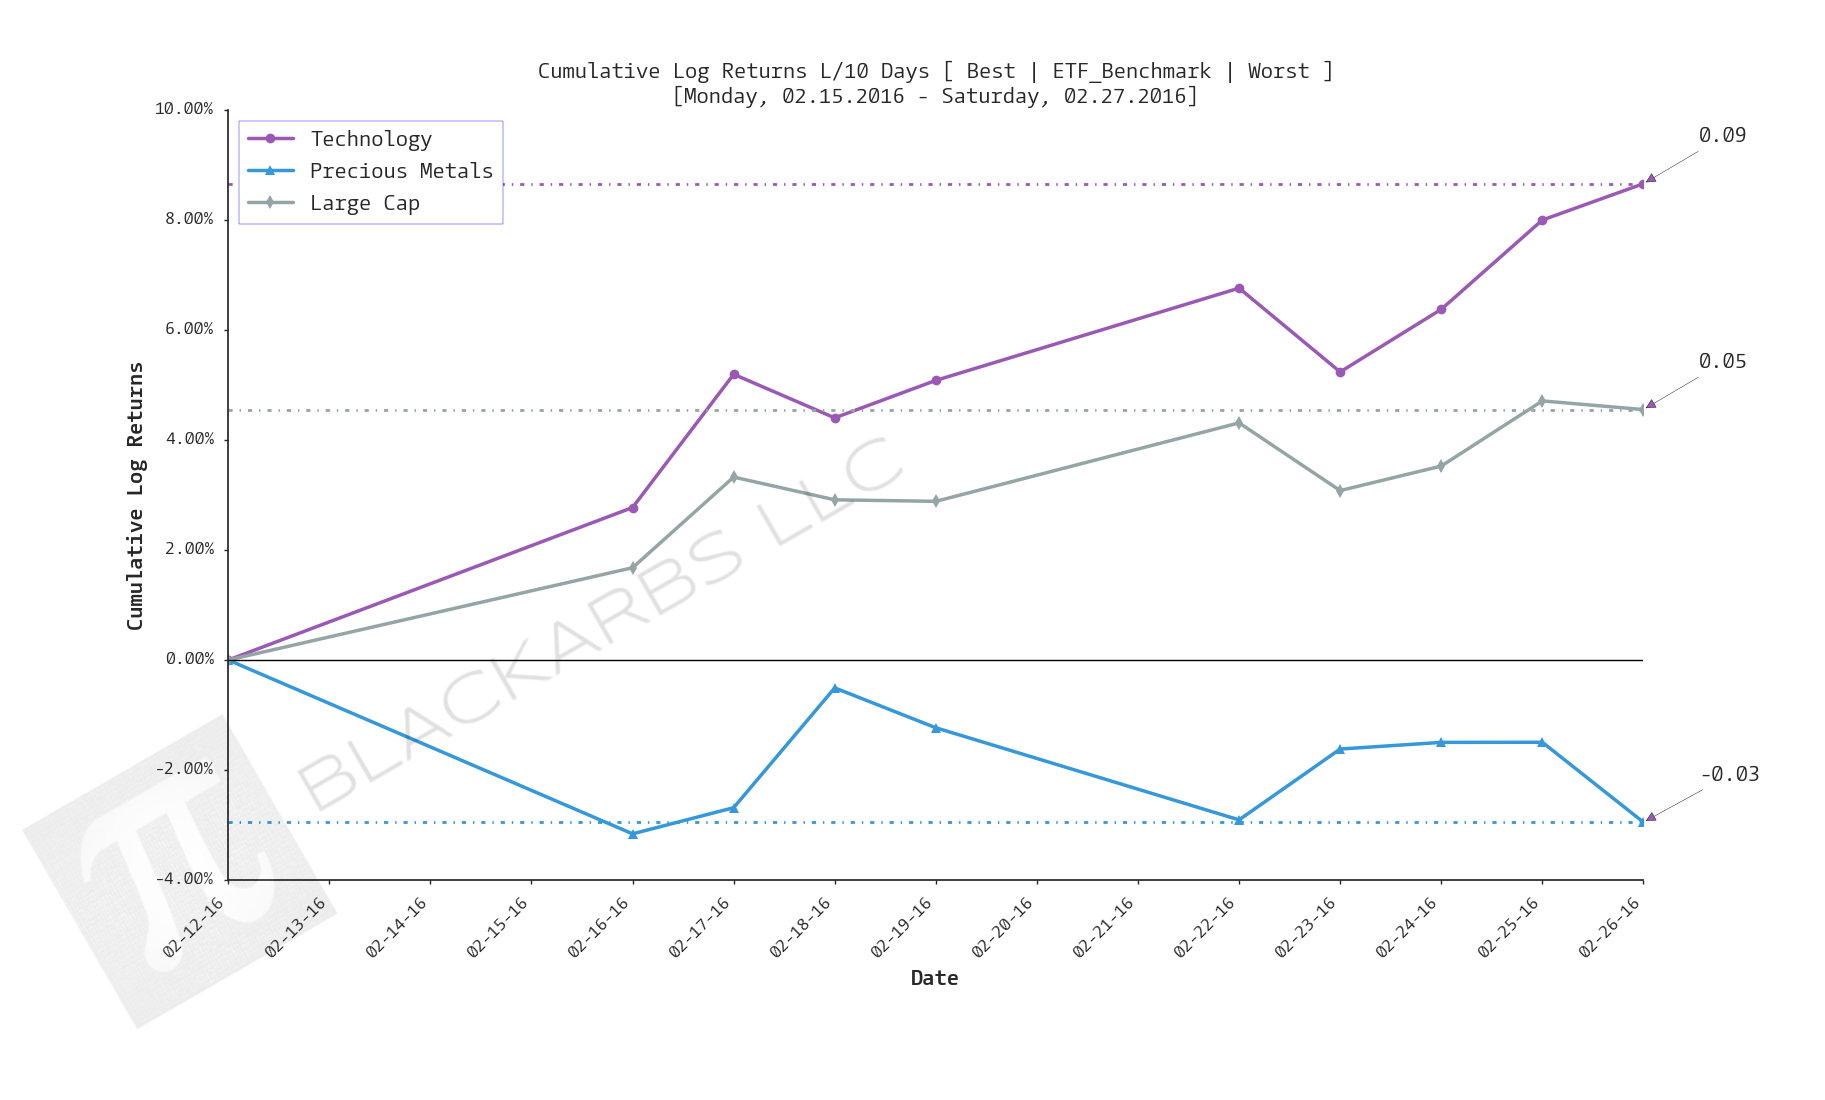
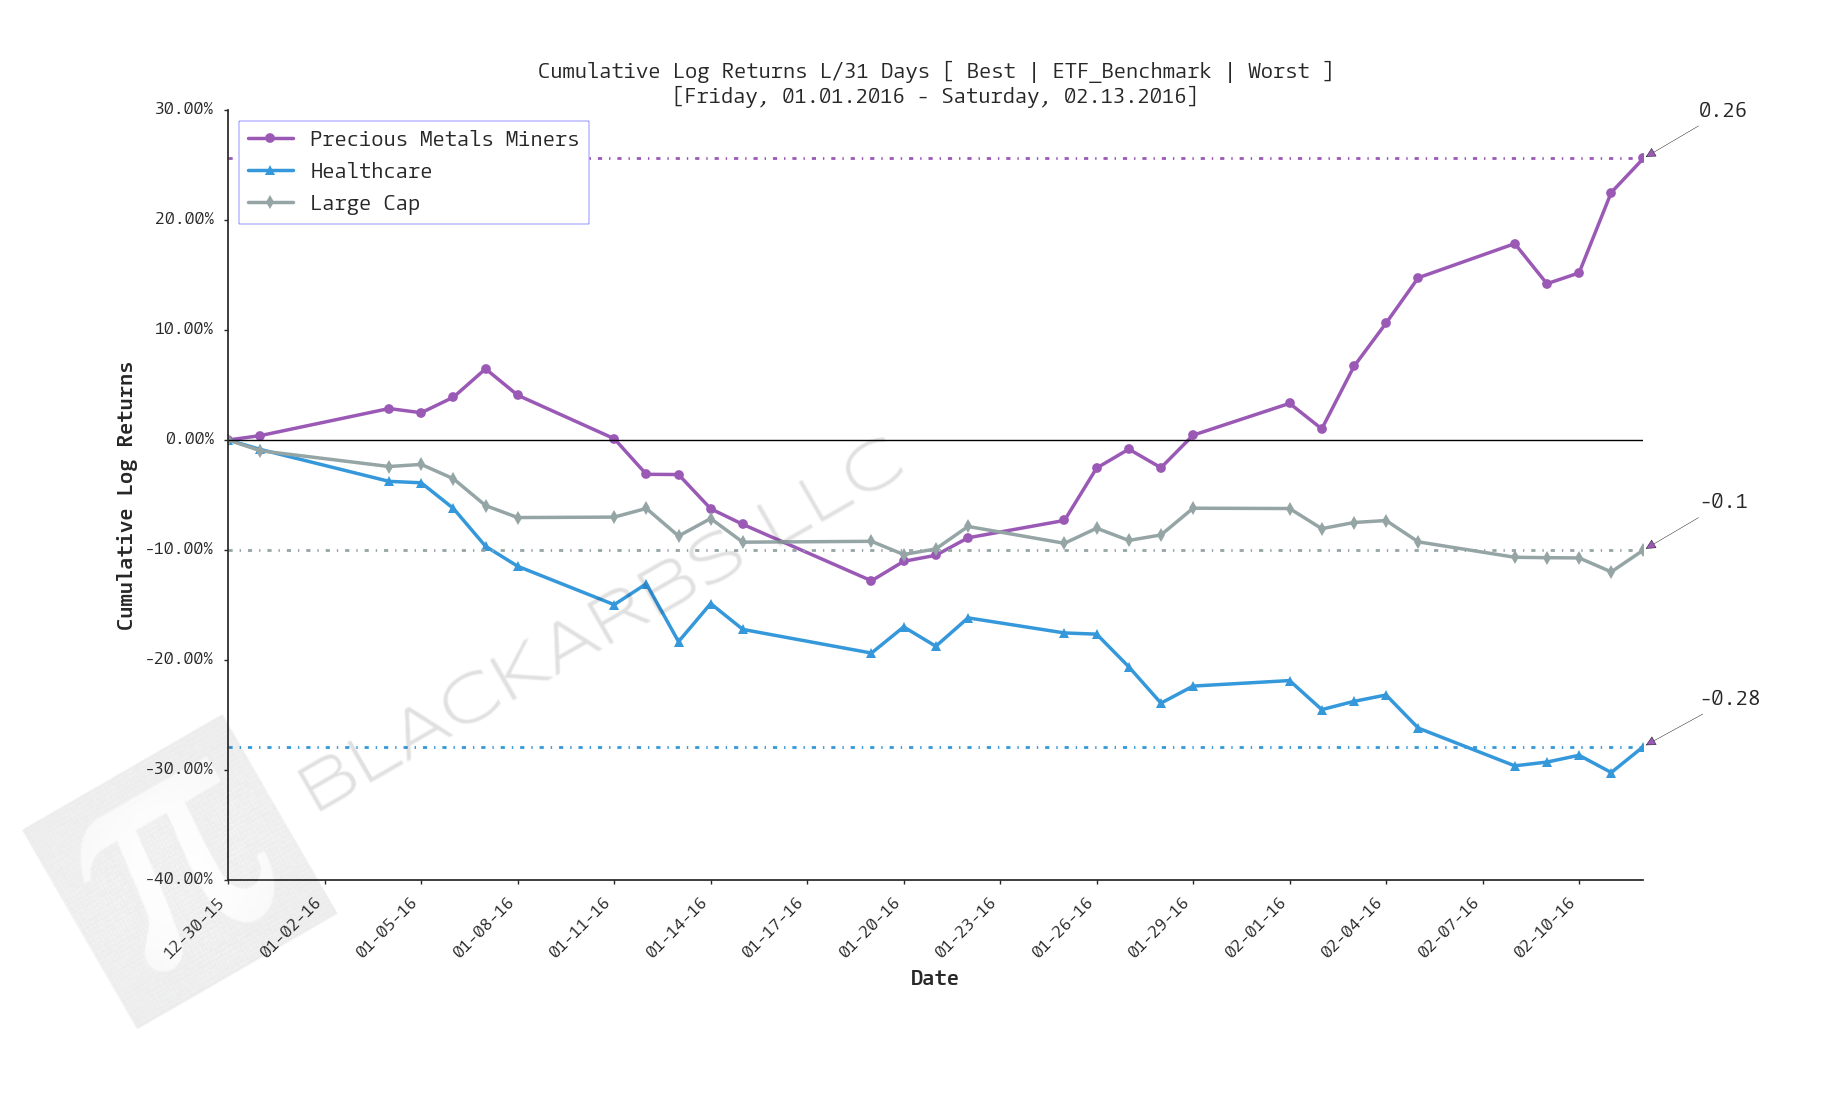
  • There are still concerns that Energy and Oil + Gas showing strong performance over the last 10 and 21 days is simply short covering and momentum traders. Fundamentally that question will be answered by tracking Oil inventories vs production. 
  • Are the AsiaPacific and Emerging/Frontier composites finally being repriced to the upside or are we simply in a "risk-on" environment where high beta is being purchased indiscriminately? This is something to pay attention to as the Implied Cost of Capital estimates show these two composites have the highest implied returns (most undervalued) over the next year. 
Read More

COMPOSITE MACRO ETF WEEKLY ANALYTICS (3/05/2016)

FOR A DEEPER DIVE INTO ETF PERFORMANCE AND RELATIVE VALUE SUBSCRIBE TO THE ETF INTERNAL ANALYTICS PACKAGE HERE

LAYOUT (Organized by Time Period): 

  1. Composite ETF Cumulative Returns Momentum Bar plot

  2. Composite ETF Cumulative Returns Line plot

  3. Composite ETF Risk-Adjusted Returns Scatter plot (Std vs Mean)

  4. Composite ETF Risk-Adjusted Return Correlations Heatmap (Clusterplot)

  5. Implied Cost of Capital Estimates

  6. Composite ETF Cumulative Return Tables

  7. Notable Trends and Observations

COMPOSITE ETF COMPONENTS:

Notable Trends and Observations

LAST 252 TRADING DAYS

Last 126 trading days

year-to-date last 46 trading days

Last 21 trading days

last 10 trading days

Implied Cost of Capital Estimates:

To learn more about the Implied Cost of Capital see here.

CATEGORY AVERAGE ICC ESTIMATES

ALL ETF ICC ESTIMATES BY CATEGORY

Cumulative Return Tables:

Notable Observations and Trends:

  • Precious Metals Miners (PMM) continue to dominate all other composites appearing as the number one outperformer several weeks in a row across multiple timeframes. This week the PMM composite is number one across the last 126 days through the last 10 days.
  • Healthcare has continued to underperform this year and while it had positive returns over the last 10 days it was still a bottom 3 performer. 
  • The markets were "Risk-on" with with T-Bonds underperforming for the last 21 days while even the Oil and Gas composite rallied towards the end of the week and finally disappeared off the worst 3 performers list last 10 days.
  • Are these bullish signs that risky assets will continue to gain, or is the market simply in a cyclical mean reversion regime where we should expect buying to be met by selling and selling to be met with more buying? The answer remains to be seen...

COMPOSITE MACRO ETF WEEKLY ANALYTICS (2/27/2016)

FOR A DEEPER DIVE INTO ETF PERFORMANCE AND RELATIVE VALUE SUBSCRIBE TO THE ETF INTERNAL ANALYTICS PACKAGE HERE

LAYOUT (Organized by Time Period): 

  1. Notable Trends and Observations

  2. Composite ETF Cumulative Returns Momentum Bar plot

  3. Composite ETF Cumulative Returns Line plot

  4. Composite ETF Risk-Adjusted Returns Scatter plot (Std vs Mean)

  5. Composite ETF Risk-Adjusted Return Correlations Heatmap (Clusterplot)

  6. Implied Cost of Capital Estimates

  7. Composite ETF Cumulative Return Tables

COMPOSITE ETF COMPONENTS:

Notable Observations and Trends:

  • Cumulative returns across a broad spectrum of composites remain weak evidenced by only Utilities and Treasuries showing gains over the last 252 days. 
  • Mid January appears to be a major turning point/trend change for the Precious Metals Miners composite. Looking at the last 126 days Best/Worst plot shows a sharp V bounce which has continued since. 
  • Investors positioning still looks defensive over the longer frames of 252, 126, 63 days as evidenced by the outperformance of the Precious Metals complex, Utilities, and Treasuries. 
  • The market overall still looks binary (risk-on/risk-off) as evidenced by the increase in inverse correlations across timeframes between risk assets (sectors, global, emerging equity) and defensive assets (precious metals, bonds, utilities, telecom) . 

LAST 252 TRADING DAYS

LAST 126 TRADING DAYS

LAST 63 TRADING DAYS

YEAR-TO-DATE LAST 41 TRADING DAYS

LAST 21 TRADING DAYS

LAST 10 TRADING DAYS

Implied Cost of Capital Estimates:

To learn more about the Implied Cost of Capital see here.

CATEGORY AVERAGE ICC ESTIMATES

ALL ETF ICC ESTIMATES BY CATEGORY

Cumulative Return Tables:

COMPOSITE MACRO ETF WEEKLY ANALYTICS (2/20/2016)

FOR A DEEPER DIVE INTO ETF PERFORMANCE AND RELATIVE VALUE SUBSCRIBE TO THE ETF INTERNAL ANALYTICS PACKAGE HERE

LAYOUT (Organized by Time Period): 

  1. Composite ETF Cumulative Returns Momentum Bar plot

  2. Composite ETF Cumulative Returns Line plot

  3. Composite ETF Risk-Adjusted Returns Scatter plot (Std vs Mean)

  4. Composite ETF Risk-Adjusted Return Correlations Heatmap (Clusterplot)

  5. Implied Cost of Capital Estimates

  6. Composite ETF Cumulative Return Tables

  7. Notable Trends and Observations

COMPOSITE ETF COMPONENTS:

LAST 252 TRADING DAYS

LAST 126 TRADING DAYS

LAST 63 TRADING DAYS

Year-to-date LAST 36 TRADING DAYS

LAST 21 TRADING DAYS

LAST 10 TRADING DAYS

Implied Cost of Capital Estimates:

To learn more about the Implied Cost of Capital see here.

CATEGORY AVERAGE ICC ESTIMATES

ALL ETF ICC ESTIMATES BY CATEGORY

Cumulative Return Tables:

Notable Observations and Trends:

  • Unfortunately not much has changed this week. Many of the themes I identified last week appear to be ongoing.
  • Defensive positioning is still prevalent as Precious Metals Miners and Precious Metals have continued to outperform.  
  • The relative strength of the Emerging/Frontier and Consumer Discretionary composites over the last 21 and 10 days respectively is somewhat interesting. This gives the appearance of "Risk-On" but the other evidence implies investors should tread carefully.
  • My current working theory is that T-Bonds provide a safe yield for global investors given the increasing popularity of NIRP. The corollary to that thesis is that the Precious Metals complex acts like a put on runaway Central Bank policy. It is likely that Precious Metals will continue to show relative strength until NIRP is removed from the Federal Reserve's policy discussion.

COMPOSITE MACRO ETF WEEKLY ANALYTICS (2/13/2016)

FOR A DEEPER DIVE INTO ETF PERFORMANCE AND RELATIVE VALUE SUBSCRIBE TO THE ETF INTERNAL ANALYTICS PACKAGE HERE

LAYOUT (Organized by Time Period): 

  1. Composite ETF Cumulative Returns Momentum Bar plot

  2. Composite ETF Cumulative Returns Line plot

  3. Composite ETF Risk-Adjusted Returns Scatter plot (Std vs Mean)

  4. Composite ETF Risk-Adjusted Return Correlations Heatmap (Clusterplot)

  5. Implied Cost of Capital Estimates

  6. Composite ETF Cumulative Return Tables

  7. Notable Trends and Observations

COMPOSITE ETF COMPONENTS:

LAST 252 TRADING DAYS

LAST 126 TRADING DAYS

LAST 63 TRADING DAYS

year-to-date LAST 31 TRADING DAYS

LAST 21 TRADING DAYS

LAST 10 TRADING DAYS

Implied Cost of Capital Estimates:

To learn more about the Implied Cost of Capital see here.

CATEGORY AVERAGE ICC ESTIMATES

ALL ETF ICC ESTIMATES BY CATEGORY

Cumulative Return Tables:

Notable Observations and Trends:

  • Investors appear to be increasing their defensive positioning in the market as evidenced by the continued relative strength in the Precious Metals/Precious Metals Miners and Treasury Bond composites.
  • Investors appear to be liquidating previous high performing asset classes as evidenced by Healthcare being among the bottom 3 performers off all composites across 5/6 timeframes beginning over the last 126 days. 
    • This is also supported by further deterioration in the relative performance of the Technology composite, which appears as a bottom 3 performer year-to-date.
  • Correlations still appear relatively binary. However, a notable change is occurring in the correlation of Oil and Gas with the rest of the Sector based composites. It appears to be weakening year-to-date as compared to the last 126/252 trading days. 
  • The Treasury bond composite is seeing a notable increase in its negative correlation with the rest of the market as well. I look for this trend to continue as long as the global Negative-Interest Rate Policy trend continues. The US offers relatively high yield when compared to negative rates!

FOR A DEEPER DIVE INTO ETF PERFORMANCE AND RELATIVE VALUE SUBSCRIBE TO THE ETF INTERNAL ANALYTICS PACKAGE HERE