'V' is the stock price at time 0, 'B' is the book value of equity at time 0, 'ROE' is return on equity, 'g' is an assumed long term growth rate and 'r' is the cost of equity/capital. The ICC model essentially solves for 'r' given the other inputs.
WHY USE THE IMPLIED COST OF CAPITAL MODEL?
There is ongoing debate regarding the ICC model's application and accuracy as a proxy for expected returns as quoted by Charles C. Y. Wang. As an investor/trader I'm less interested in the academic debate and more intrigued by the intuition behind the model and its practical application as a relative value tool.
I use the ICC model as a relative value measure to identify analyst/institutional expectations and sentiment between different market sectors at a point in time.
For this purpose I believe it provides great insight.
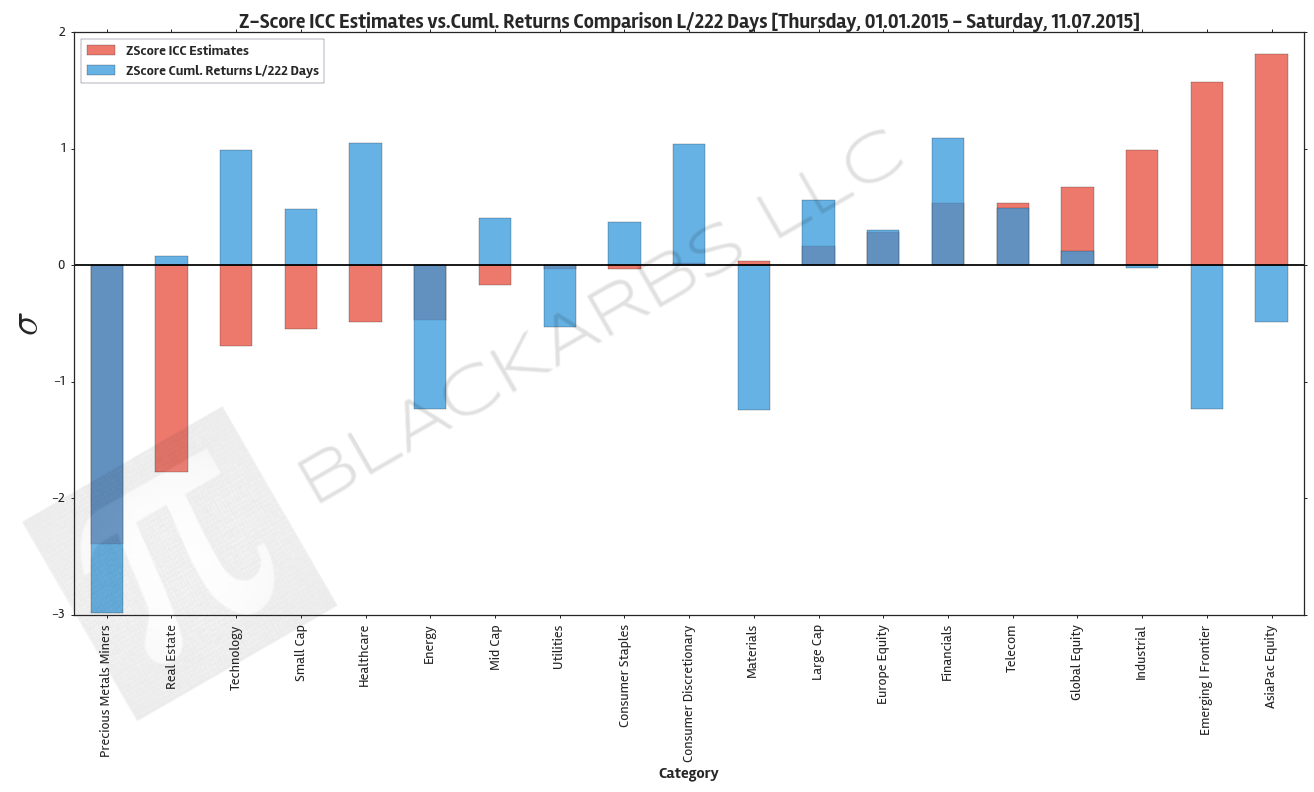
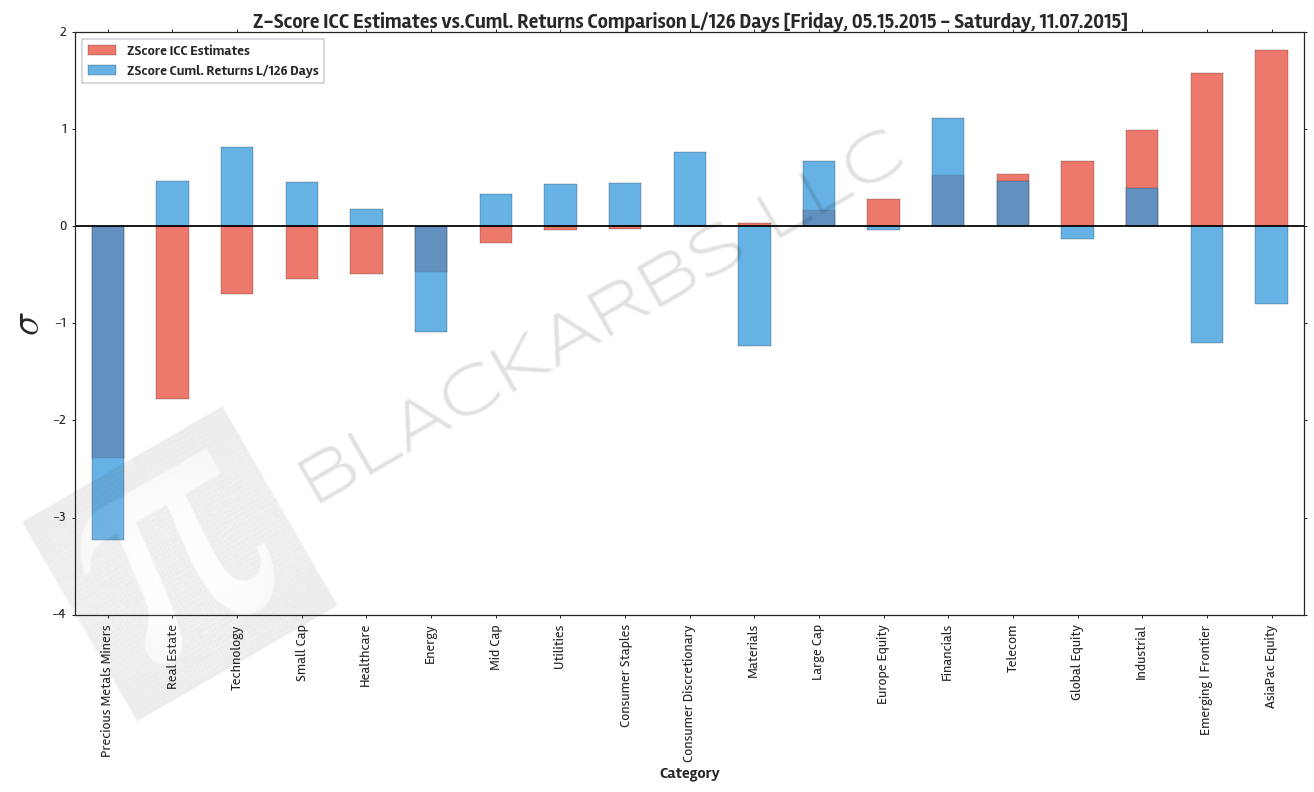
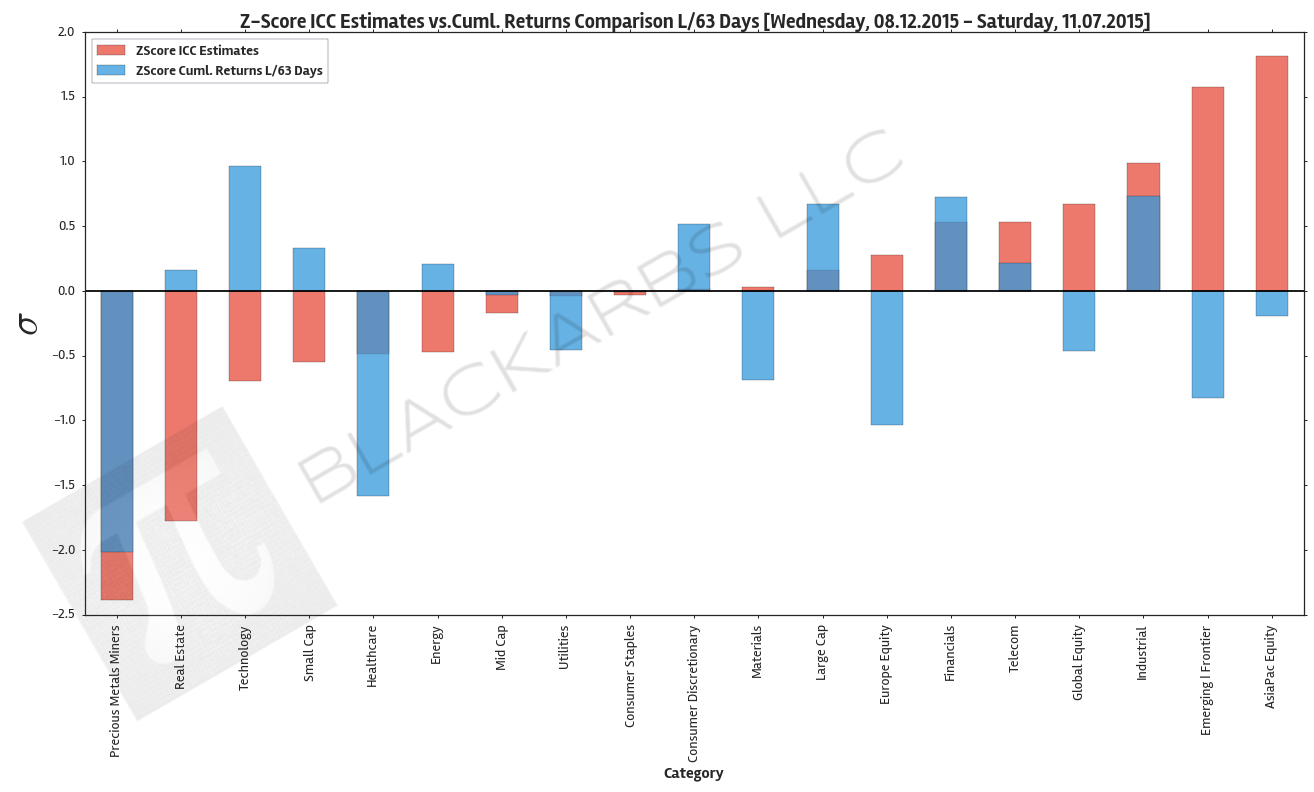
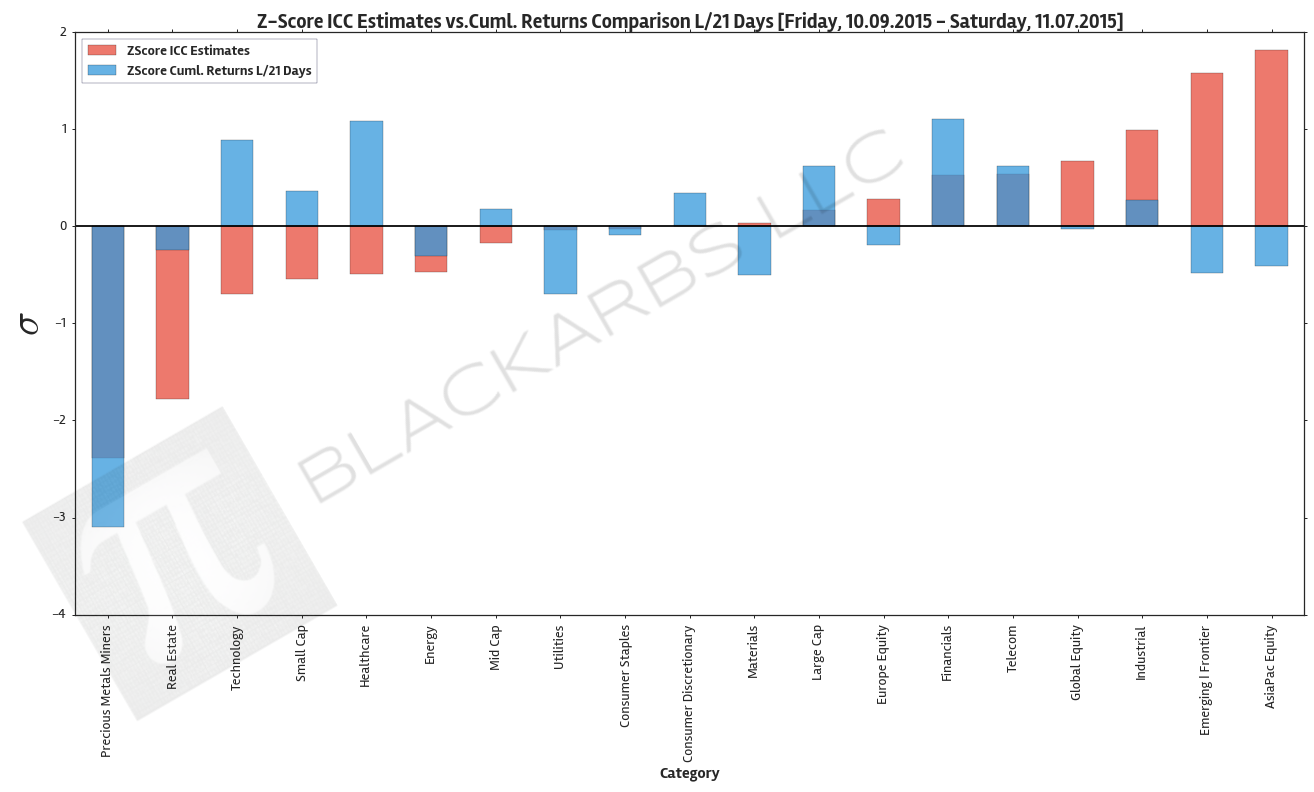
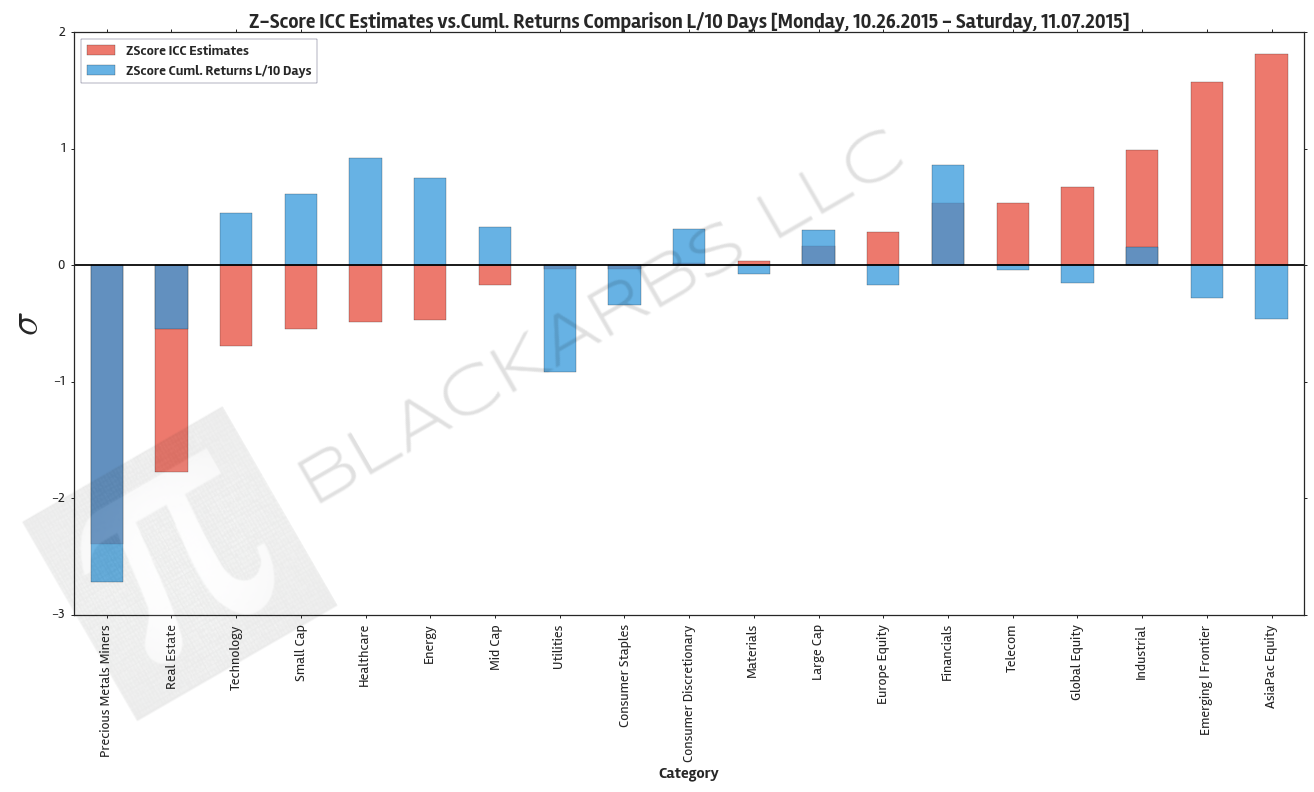
Z-SCORE ICC ESTIMATES AND CUMULATIVE RETURNS COMPARISON CHART
The below plot gives visual representation of the ICC estimates. I z-scored both year-to-date cumulative returns and the ICC estimates so we can view them on the same scale. Examining this chart allows investors to quickly determine which market sectors are outperforming (underperforming) their respective Implied Cost of Capital Estimates.
The extreme cases show where there are disconnects between the analyst community's forward earnings expectations and actual market performance. The plot is sorted left to right by ascending ICC estimates.
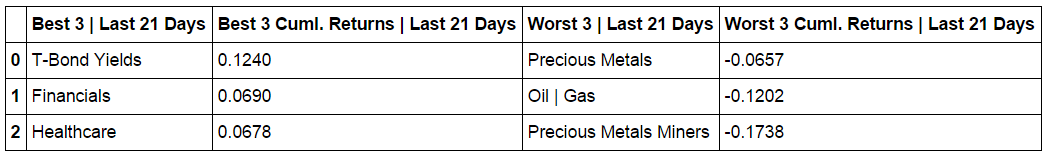
year-to-date last 222 trading days